
Web Server Analytics: Understanding What Happens Behind the Scenes
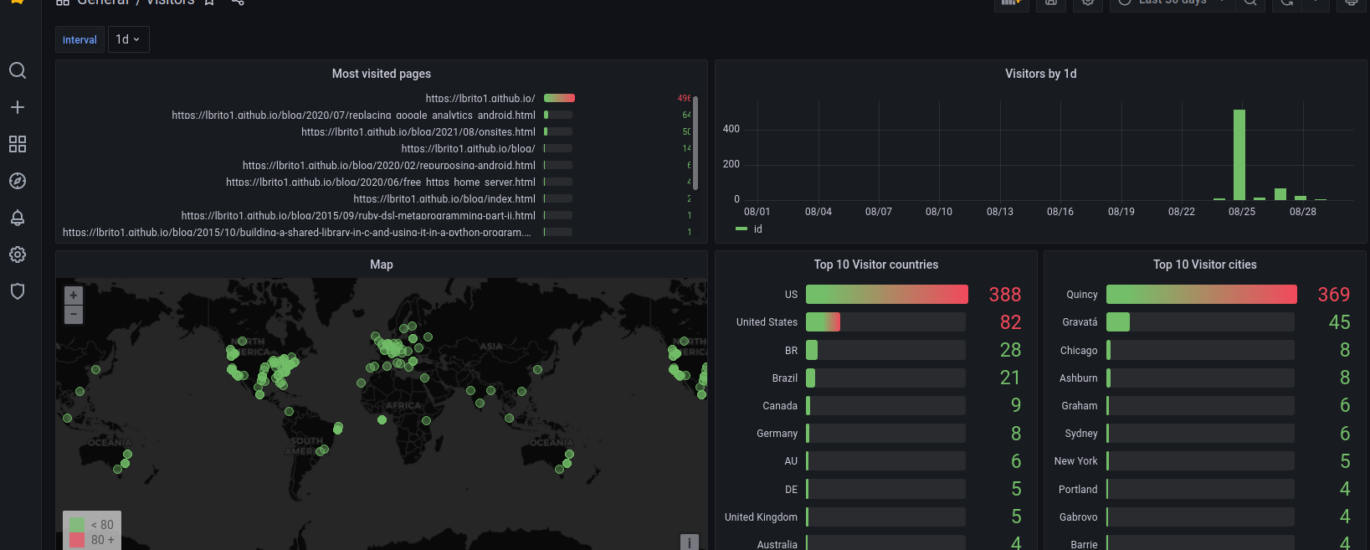
A website’s visible pages are only part of the story. Behind every visit, a web server handles requests, delivers content and records information about how the site is being used. Web server analytics turns this information into useful insight, helping website owners understand performance, spot problems and make informed decisions.
What is web server analytics?
Web server analytics is the process of examining data generated when a server responds to requests from browsers, apps, search engine crawlers and other systems. Much of this data is stored in server logs: records of events such as a page being requested, a file being delivered or an error occurring.
Unlike analytics based solely on tracking code in a webpage, server log analysis can include requests that do not run JavaScript. This may provide a broader view of activity, although it does not automatically reveal who a visitor is or why they made a request.
What information can server logs contain?
The exact details depend on the server and its configuration, but a log entry may include:
- The date and time of a request
- The requested URL and HTTP method
- The response status code, such as 200, 404 or 500
- The amount of data transferred
- The time taken to respond
- The referring page and browser user-agent string
- An IP address or other network information
These fields help build a picture of how a site is functioning. For example, repeated 404 responses may point to broken links, while a rise in server errors could indicate an application or infrastructure issue.
Why analyse web server data?
Monitor performance
Response times and traffic volumes can help reveal whether a website is keeping up with demand. A sudden increase in slow responses may coincide with a traffic spike, a database bottleneck or a deployment problem. Reviewing performance over time can also help teams assess whether changes have improved the experience.
Find errors and security concerns
Logs can make it easier to investigate failed requests, recurring application errors and unusual patterns of access. They may help identify automated scanning, repeated login attempts or unexpected traffic to sensitive routes. Log data is only one part of security monitoring, but it can provide valuable evidence when used alongside other safeguards.
Understand search engine crawling
Server logs can show which pages search engine crawlers request and how often they return. This can help website owners identify pages that are being overlooked, crawled excessively or producing errors. It is useful to interpret this information carefully: a crawler request does not guarantee that a page will be indexed or appear in search results.
Plan capacity
Traffic patterns can help inform decisions about hosting resources, caching and content delivery. If requests regularly peak at particular times, teams can plan for those periods and investigate whether frequently requested files could be served more efficiently.
Common metrics and status codes
Useful measures include request volume, bandwidth, response time, error rate and the number of requests returning different status codes. These figures become more meaningful when compared over time or grouped by page, service or environment.
- 200: The request was handled successfully.
- 301 or 302: The requested resource redirected elsewhere.
- 404: The requested resource could not be found.
- 429: The client made too many requests within a given period.
- 500: The server encountered an error while handling the request.
A status code alone rarely explains the cause of a problem. For example, a 404 may be expected if a visitor follows an old link, while a 500 response needs further investigation to identify the underlying fault.
Server logs and website analytics tools
Traditional website analytics platforms often use a tag or script in the page to record visits and interactions. Server logs record requests handled by the server. The two approaches answer different questions and can complement one another.
Page analytics may offer convenient reports about sessions, conversions and on-page events. Log analysis can be especially useful for diagnosing server responses, reviewing crawler activity and examining requests that client-side scripts may not record. Neither source is complete in every situation: caching, proxies, bots, blocked scripts and configuration choices can all affect the data.
Privacy and responsible data handling
Server logs can contain personal data, including IP addresses or information in URLs. Organisations should decide what they genuinely need to retain, restrict access to logs and set sensible retention periods. Where appropriate, data can be minimised, anonymised or aggregated before analysis.
In the UK, organisations should consider their obligations under applicable data protection law, including the UK GDPR and the Data Protection Act 2018. The right approach depends on the data collected and how it is used. Privacy notices, internal policies and legal advice may be needed to ensure that monitoring is transparent and proportionate.
Getting started with web server analytics
- Define your questions. Decide whether the priority is performance, errors, security, search crawling or capacity planning.
- Check what is being recorded. Review the server’s log format, time zone, retention settings and any information that may be sensitive.
- Choose suitable tools. Options range from command-line utilities to log-management platforms and monitoring services. Consider the volume of data, required reports, cost and access controls.
- Establish a baseline. Record normal traffic, response times and error rates so that unusual changes are easier to recognise.
- Review findings regularly. Set alerts for important issues, but avoid generating so many notifications that meaningful warnings are missed.
- Turn observations into action. A report is valuable when it leads to a clear next step, such as fixing a broken route, improving caching or investigating a slow service.
Conclusion
Web server analytics provides a practical view of how a website’s infrastructure handles requests. By examining logs and performance measures, teams can diagnose faults, assess traffic, understand crawler behaviour and plan for future demand. The strongest results come from combining reliable data with clear questions, careful interpretation and responsible handling of information.
Understanding Web Server Analytics: Key FAQs Explained
- What is the web analytics?
- What is meant by web analytics?
- What are the different types of web analytics?
- What is web and network analytics?
- What is web analytics service?
- What is an analytics server?
- What are the 4 types of analytics?
What is the web analytics?
Web analytics is the collection and analysis of data about how people use a website. It can show how visitors arrive, which pages they view and how they interact with the site, helping organisations improve content and user experience. Web server analytics focuses specifically on data recorded by the server, such as requests, response times and error codes, offering insight into website performance and technical issues.
What is meant by web analytics?
Web analytics is the collection and analysis of data about how people use a website or online service. It helps organisations understand where visitors come from, which pages they view, how they interact with content and whether they complete key actions, such as making a purchase or submitting a form. These insights can guide improvements to website performance, content and user experience.
What are the different types of web analytics?
The main types of web analytics are on-site analytics, which tracks activity on your website, such as page views, visits and conversions; off-site analytics, which measures your website’s presence beyond its own pages, including links, mentions and social engagement; and web server analytics, which examines server logs to show requests, response times, errors and crawler activity. These approaches offer different perspectives and can be used together to build a fuller picture of website performance.
What is web and network analytics?
Web and network analytics is the collection and analysis of data about how websites, applications and networks are used and perform. Web analytics can show how people find and interact with a website, while network analytics examines traffic moving across a network, including its volume, speed and patterns. Together, these insights can help organisations improve user experience, troubleshoot performance issues, plan capacity and identify unusual activity.
What is web analytics service?
A web analytics service collects and analyses information about how people use a website. It can report on visits, page views, traffic sources and user interactions, helping website owners understand what is working and where improvements may be needed. Depending on the service, it may use tracking code, server logs or a combination of data sources. Since analytics can involve personal data, it is important to choose a service that suits your privacy requirements and to handle information responsibly.
What is an analytics server?
An analytics server is a system that collects, processes and stores data about activity on a website or app. In web server analytics, it may analyse server logs to show details such as page requests, response times, errors and traffic patterns. This helps website owners understand how their site is performing and identify issues, while the data collected should be handled responsibly and in line with privacy requirements.
What are the 4 types of analytics?
The four main types of analytics are descriptive, diagnostic, predictive and prescriptive. Descriptive analytics explains what has happened, such as how many requests a web server received; diagnostic analytics explores why it happened, for example by investigating a traffic spike or rise in errors. Predictive analytics uses historical patterns to estimate what may happen next, while prescriptive analytics recommends actions, such as adding server capacity or adjusting caching, to achieve a better outcome.