The Power of SAS Data Analysis
Data analysis plays a crucial role in deriving meaningful insights from vast amounts of information. Among the various tools available for data analysis, SAS (Statistical Analysis System) stands out as a powerful and versatile platform that is widely used across industries.
Efficiency and Accuracy
SAS offers a comprehensive set of tools and capabilities for data manipulation, statistical analysis, and reporting. Its user-friendly interface allows data analysts to perform complex analyses with ease, leading to more efficient workflows and accurate results.
Advanced Analytics
With SAS, users can leverage advanced analytics techniques such as predictive modelling, machine learning, and artificial intelligence to uncover hidden patterns and trends in data. These capabilities enable organisations to make informed decisions and drive business growth.
Data Visualisation
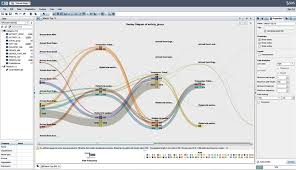
Visualising data is essential for understanding complex relationships within datasets. SAS provides powerful visualisation tools that allow users to create interactive graphs, charts, and dashboards that communicate insights effectively.
Scalability and Flexibility
Whether working with small datasets or big data environments, SAS offers scalability to handle varying data sizes efficiently. Its flexible architecture allows integration with other systems and technologies, making it a versatile solution for diverse analytical needs.
Compliance and Security
In industries where data security and compliance are paramount, SAS provides robust features for ensuring data privacy, integrity, and regulatory compliance. This makes it a trusted choice for organisations handling sensitive information.
Conclusion
In conclusion, SAS data analysis empowers organisations to extract valuable insights from their data assets effectively. By leveraging its advanced analytics capabilities, intuitive interface, scalability, and security features, businesses can gain a competitive edge in today’s data-driven world.
Top 5 Essential Tips for Effective SAS Data Analysis
- Ensure your data is clean and well-structured before starting analysis.
- Use descriptive statistics to summarise and understand your data.
- Visualise your data using graphs and charts to identify patterns and trends.
- Perform hypothesis testing to make statistically sound conclusions.
- Document your analysis process thoroughly for reproducibility.
Ensure your data is clean and well-structured before starting analysis.
Before delving into SAS data analysis, it is essential to ensure that your data is clean and well-structured. Clean data free of errors, inconsistencies, and duplicates ensures the accuracy and reliability of your analysis results. Well-structured data organised in a logical format makes it easier to navigate and extract meaningful insights efficiently. Taking the time to prepare and clean your data before starting the analysis process sets a solid foundation for deriving valuable conclusions and making informed decisions based on reliable information.
Use descriptive statistics to summarise and understand your data.
Utilising descriptive statistics is a fundamental tip in SAS data analysis to effectively summarise and gain a deeper understanding of your data. By calculating measures such as mean, median, standard deviation, and quartiles, you can uncover key characteristics and trends within your dataset. These statistical summaries provide valuable insights into the central tendency, variability, and distribution of your data, enabling informed decision-making and further exploration of patterns or anomalies. Incorporating descriptive statistics in your analysis process enhances the clarity and interpretability of your findings, laying a strong foundation for more advanced analytical techniques in SAS.
Visualise your data using graphs and charts to identify patterns and trends.
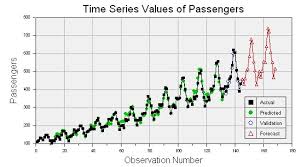
Visualising data through graphs and charts is a valuable tip in SAS data analysis. By representing data visually, analysts can easily identify patterns, trends, and relationships that may not be apparent from raw numbers alone. Graphical representations provide a clear and intuitive way to communicate insights, making it easier for decision-makers to understand complex data sets. Utilising graphs and charts in SAS analysis enhances the interpretability of results and enables more informed decision-making based on visual evidence.
Perform hypothesis testing to make statistically sound conclusions.
Performing hypothesis testing in SAS data analysis is essential for making statistically sound conclusions based on the data at hand. By setting up null and alternative hypotheses and conducting appropriate statistical tests, analysts can determine the significance of relationships or differences within the data. This rigorous process helps validate findings and provides confidence in decision-making, ensuring that conclusions drawn from the analysis are supported by solid statistical evidence.
Document your analysis process thoroughly for reproducibility.
Ensuring the reproducibility of data analysis is paramount in the field of SAS. One crucial tip to achieve this is to meticulously document the analysis process. By thoroughly documenting each step taken, including data preparation, statistical methods used, and interpretation of results, analysts can replicate the analysis accurately in the future. This documentation not only enhances transparency but also allows for validation by peers and stakeholders, ultimately reinforcing the reliability and credibility of the analysis outcomes.


