Understanding Regression Statistics in Excel
Regression analysis is a powerful statistical tool used to understand the relationship between variables. In Excel, you can perform regression analysis easily using the built-in tools. By utilising regression statistics in Excel, you can uncover valuable insights from your data.
How to Perform Regression Analysis in Excel
To conduct regression analysis in Excel, you typically use the ‘Data Analysis’ tool. This tool allows you to fit a regression model to your data and obtain key statistics such as coefficients, R-squared value, and more. Here’s a basic guide on how to perform regression analysis in Excel:
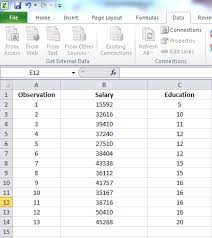
- Organise your data: Ensure that your independent and dependent variables are properly arranged in columns.
- Select ‘Data Analysis’: Go to the ‘Data’ tab, click on ‘Data Analysis’ in the ‘Analysis’ group.
- Choose ‘Regression’: In the Data Analysis dialog box, select ‘Regression’ and click ‘OK’.
- Enter input range: Specify the input Y range (dependent variable) and X range (independent variable).
- Select output options: Choose where you want the output to be displayed (e.g., new worksheet) and select any additional options.
- Review results: Once you click ‘OK’, Excel will generate the regression output with coefficients, significance levels, and other relevant statistics.
Interpreting Regression Statistics
When interpreting regression statistics in Excel, it’s essential to focus on key metrics such as:
- R-squared: This value indicates how well the independent variables explain the variability of the dependent variable. A higher R-squared value signifies a better fit.
- Coefficients: These values represent the impact of each independent variable on the dependent variable. Positive coefficients indicate a positive relationship, while negative coefficients suggest a negative relationship.
- P-values: P-values assess the significance of each coefficient. Lower p-values indicate greater significance.
Benefits of Using Regression Statistics in Excel
The advantages of utilising regression statistics in Excel include:
- Data visualisation: Excel provides visual aids such as scatter plots and trendlines to help you understand relationships between variables.
- Data manipulation: You can easily manipulate and analyse large datasets using Excel’s functions and tools.
- Ease of use: Performing regression analysis in Excel is user-friendly and does not require advanced statistical knowledge.
In conclusion, mastering regression statistics in Excel can enhance your data analysis capabilities significantly. By harnessing this powerful tool, you can gain valuable insights into your data and make informed decisions based on statistical evidence.
Understanding Regression Analysis in Excel: Top 8 FAQs Answered
- How to do regression statistics in Excel?
- How do you calculate R-Squared in Excel regression?
- How to interpret f statistic in regression Excel?
- How do I find the best regression model in Excel?
- How do you find regression statistics?
- How to find b0 and b1 in Excel?
- How do you calculate regression in statistics?
- How to do regression in Excel with multiple variables?
How to do regression statistics in Excel?
One frequently asked question regarding regression statistics in Excel is, “How to do regression statistics in Excel?” Performing regression analysis in Excel involves utilising the built-in ‘Data Analysis’ tool to fit a regression model to your data. By organising your independent and dependent variables correctly, selecting the ‘Regression’ option within the Data Analysis dialog box, and interpreting key metrics such as coefficients and R-squared values, you can effectively conduct regression analysis in Excel. This user-friendly process allows individuals to uncover valuable insights from their data and make informed decisions based on statistical evidence.
How do you calculate R-Squared in Excel regression?
Calculating R-Squared in Excel regression is a common query among users seeking to understand the goodness-of-fit of their regression model. In Excel, R-Squared, also known as the coefficient of determination, can be easily calculated by squaring the correlation coefficient between the observed and predicted values of the dependent variable. This metric ranges from 0 to 1, where a value closer to 1 indicates a better fit of the regression model to the data. By computing R-Squared in Excel regression, users can assess how well their independent variables explain the variability in the dependent variable, providing valuable insights into the strength of their regression analysis results.
How to interpret f statistic in regression Excel?
The F-statistic in regression analysis conducted in Excel is a crucial metric that helps assess the overall significance of the regression model. When interpreting the F-statistic, it is essential to understand that a high F-value indicates that the independent variables collectively have a significant impact on the dependent variable. In contrast, a low F-value suggests that the model may not be statistically significant. By examining the F-statistic in Excel, analysts can determine whether the regression model as a whole provides valuable insights into the relationship between variables and aids in making informed decisions based on statistical evidence.
How do I find the best regression model in Excel?
When seeking the best regression model in Excel, it is crucial to employ a systematic approach to ensure accurate and reliable results. To determine the optimal regression model, one can utilise techniques such as adjusting variables, testing different model specifications, and evaluating statistical metrics like R-squared and p-values. By iteratively refining the model based on these criteria, one can identify the regression model that best fits the data and provides meaningful insights. Additionally, employing cross-validation methods can help assess the model’s predictive performance and generalisability. Through diligent experimentation and analysis, users can identify the most suitable regression model in Excel for their specific data set and research objectives.
How do you find regression statistics?
To find regression statistics in Excel, you can utilise the built-in ‘Data Analysis’ tool. This tool allows you to perform regression analysis by fitting a model to your data and obtaining essential statistics like coefficients, R-squared values, and p-values. By following a few simple steps, such as organising your data, selecting the regression analysis option, and interpreting the generated output, you can easily uncover valuable insights into the relationships between variables in your dataset. Excel’s user-friendly interface and powerful analytical capabilities make it an excellent tool for conducting regression analysis and obtaining meaningful statistical results.
How to find b0 and b1 in Excel?
To find b0 and b1 coefficients in Excel for regression analysis, you can use the LINEST function. The b0 coefficient represents the intercept of the regression line, while the b1 coefficient signifies the slope. By inputting the independent and dependent variables into Excel, you can then apply the LINEST function to calculate these coefficients accurately. Understanding how to find b0 and b1 in Excel is crucial for interpreting regression results and gaining insights into the relationship between variables within your dataset.
How do you calculate regression in statistics?
In statistics, calculating regression involves fitting a mathematical model to a set of data points to understand the relationship between variables. Specifically, in the context of linear regression, the process typically entails determining the best-fitting line that minimises the sum of squared differences between the observed data points and the predicted values generated by the model. This is achieved by estimating coefficients that represent the slope and intercept of the line. In Excel, for instance, you can calculate regression statistics by using tools like Data Analysis to perform regression analysis on your dataset and obtain key metrics such as coefficients, R-squared value, and p-values that help quantify and interpret the relationship between variables.
How to do regression in Excel with multiple variables?
When conducting regression analysis in Excel with multiple variables, it is essential to follow a systematic approach to ensure accurate results. To perform regression with multiple variables in Excel, you can use the ‘Data Analysis’ tool and select the ‘Regression’ option. Organise your data with the dependent variable and all independent variables in separate columns. Specify the input ranges for all variables and choose where you want the output to be displayed. By running the regression analysis, Excel will provide you with coefficients for each variable, R-squared value, and other relevant statistics that help you understand the relationships between multiple variables in your dataset. This method allows for a comprehensive analysis of how each independent variable contributes to explaining the variability of the dependent variable, providing valuable insights for decision-making based on statistical evidence.