Data Analysis Using SPSS
SPSS (Statistical Package for the Social Sciences) is a powerful software tool used for statistical analysis in various fields such as social sciences, business, and research. It provides a user-friendly interface that allows researchers to manipulate and analyse data efficiently.
Data Input and Management
One of the key features of SPSS is its ability to handle large datasets with ease. Users can input data from various sources such as Excel spreadsheets or databases and organise them into variables and cases for analysis. SPSS also allows for data cleaning and manipulation to ensure accuracy in the analysis process.
Descriptive Statistics
SPSS offers a wide range of tools for descriptive statistics, including measures of central tendency, variability, and distribution. Researchers can generate frequency tables, histograms, and other visualisations to explore the characteristics of their data before moving on to more advanced analyses.
Hypothesis Testing
With SPSS, researchers can conduct a variety of hypothesis tests to determine the significance of relationships within their data. These tests include t-tests, ANOVA, chi-square tests, correlation analysis, and regression analysis. SPSS provides detailed output that helps interpret the results effectively.
Data Visualisation
Visualising data is crucial for understanding trends and patterns within datasets. SPSS offers various tools for creating charts, graphs, and plots that aid in presenting findings in a clear and concise manner. Users can customise visualisations to suit their needs and enhance the impact of their analyses.
Conclusion
Overall, SPSS is a versatile tool that simplifies the process of data analysis for researchers across different disciplines. Its intuitive interface, robust statistical capabilities, and comprehensive output make it an essential software for making informed decisions based on data-driven insights.
Essential Tips for Effective Data Analysis Using SPSS
- Ensure your data is clean and properly formatted before importing it into SPSS.
- Familiarise yourself with SPSS syntax to perform more advanced analyses and automate repetitive tasks.
- Use the ‘Variable View’ in SPSS to define variable properties such as labels, values, and missing data.
- Explore different chart options in SPSS to visually represent your data for better understanding.
- Utilise the ‘Analyse’ menu in SPSS to access a wide range of statistical tests and procedures for data analysis.
- Document your analysis steps and results thoroughly to ensure reproducibility and clarity in reporting.
Ensure your data is clean and properly formatted before importing it into SPSS.
Before importing your data into SPSS for analysis, it is crucial to ensure that your data is clean and properly formatted. Clean data free of errors and inconsistencies will lead to more accurate results and smoother analysis processes. Proper formatting, such as correctly labelling variables and cases, will help SPSS interpret the data accurately. Taking the time to prepare your data meticulously before importing it into SPSS can save you valuable time and effort in the long run, ensuring that your analysis is based on reliable and high-quality data.
Familiarise yourself with SPSS syntax to perform more advanced analyses and automate repetitive tasks.
To enhance your data analysis capabilities in SPSS, it is beneficial to familiarise yourself with SPSS syntax. By mastering SPSS syntax, you can perform more advanced analyses and automate repetitive tasks efficiently. This knowledge allows you to customise analyses, create complex statistical models, and streamline your workflow. Embracing SPSS syntax empowers you to delve deeper into your data and unlock new insights that may not be easily achievable through the software’s graphical interface alone.
Use the ‘Variable View’ in SPSS to define variable properties such as labels, values, and missing data.
When conducting data analysis using SPSS, it is highly beneficial to utilise the ‘Variable View’ feature to define essential properties of variables. By accessing the ‘Variable View’, researchers can specify labels, values, and missing data for each variable in their dataset. This ensures clarity and accuracy in data interpretation and analysis, as well as streamlining the process of conducting statistical tests and generating meaningful insights from the data. Properly defining variable properties in SPSS’s ‘Variable View’ enhances the overall quality and reliability of the analysis results.
Explore different chart options in SPSS to visually represent your data for better understanding.
Exploring different chart options in SPSS can greatly enhance the visual representation of your data, leading to a clearer and more insightful understanding of your findings. By utilising a variety of charts such as bar graphs, scatter plots, and histograms, researchers can effectively communicate trends, patterns, and relationships within their datasets. Visual representations not only make complex data easier to interpret but also help in conveying key insights to stakeholders in a compelling and engaging manner.
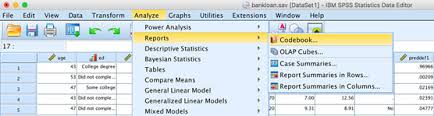
Utilise the ‘Analyse’ menu in SPSS to access a wide range of statistical tests and procedures for data analysis.
To enhance your data analysis capabilities in SPSS, make sure to utilise the ‘Analyse’ menu, which provides access to a diverse array of statistical tests and procedures. By exploring this menu, researchers can efficiently conduct various analyses such as hypothesis testing, correlation studies, and regression analysis. Leveraging the tools available in the ‘Analyse’ menu empowers users to delve deeper into their data, extract meaningful insights, and make informed decisions based on robust statistical findings.
Document your analysis steps and results thoroughly to ensure reproducibility and clarity in reporting.
It is essential to document your analysis steps and results thoroughly when using SPSS to ensure reproducibility and clarity in reporting. By detailing each step taken during the data analysis process, including data preparation, variable transformations, statistical tests conducted, and interpretations of results, you not only enhance the reproducibility of your findings but also provide transparency in your research methodology. Clear documentation allows others to follow your analytical path accurately, verify your conclusions, and build upon your work with confidence.