The Power of Regression Analysis in Excel
Regression analysis is a statistical technique used to understand the relationship between variables. When performed in Microsoft Excel, regression analysis becomes a powerful tool for making predictions and uncovering insights from data.
How Does Regression Analysis Work in Excel?
Excel offers various functions and tools to perform regression analysis easily. By using the built-in Data Analysis Toolpak, users can run regression models to identify patterns and relationships within their datasets. This allows for the creation of predictive models that can forecast future trends based on historical data.
Benefits of Using Regression Analysis in Excel
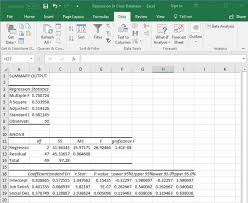
One of the key advantages of conducting regression analysis in Excel is its user-friendly interface. With just a few clicks, users can generate regression output, including coefficients, p-values, and R-squared values, which help assess the strength of the relationship between variables.
Additionally, Excel provides visual representations of regression results through scatter plots and trendlines, making it easier to interpret and communicate findings to stakeholders.
Applications of Regression Analysis in Excel
Regression analysis in Excel finds applications across various fields, including finance, marketing, economics, and more. In finance, it can be used to predict stock prices based on historical data trends. In marketing, regression analysis helps identify factors that influence consumer behaviour and purchase decisions.
Moreover, businesses can leverage regression analysis in Excel to forecast sales figures, optimise pricing strategies, or evaluate the impact of marketing campaigns on revenue growth.
Challenges and Considerations
While Excel offers a convenient platform for conducting regression analysis, users should be mindful of potential limitations. These may include assumptions about linearity and independence of variables or the need for additional statistical tests to validate model accuracy.
It is essential for users to understand the fundamentals of regression analysis and interpret results critically to avoid drawing incorrect conclusions that could lead to flawed decision-making.
In Conclusion
Regression analysis in Excel empowers users with valuable insights into relationships within their datasets. By harnessing this statistical technique effectively, businesses can make informed decisions based on data-driven predictions and enhance their strategic planning processes.
Excel’s regression capabilities offer a straightforward yet powerful approach to analysing data and unlocking hidden patterns that drive business success.
Essential FAQs on Conducting Regression Analysis in Excel
- How do I perform regression analysis in Excel?
- What are the key steps to run a regression model in Excel?
- Can Excel calculate coefficients and R-squared values for regression analysis?
- How can I interpret the results of regression analysis in Excel?
- Are there any common pitfalls to avoid when conducting regression analysis in Excel?
How do I perform regression analysis in Excel?
Performing regression analysis in Excel is a common query among users seeking to analyse relationships between variables in their datasets. To conduct regression analysis in Excel, users can utilise the built-in Data Analysis Toolpak, which offers a range of statistical tools, including regression models. By following simple steps within Excel, such as selecting the relevant data range, specifying input and output variables, and interpreting the generated results, users can easily perform regression analysis to uncover valuable insights and make informed decisions based on data-driven predictions. Utilising Excel’s intuitive interface and functionalities makes conducting regression analysis accessible to a wide range of users, empowering them to explore relationships within their data effectively.
What are the key steps to run a regression model in Excel?
To run a regression model in Excel, there are several key steps to follow. First, ensure that your data is well-organised with the dependent variable and independent variables clearly defined in separate columns. Next, enable the Data Analysis Toolpak in Excel to access regression analysis functions. Then, select the appropriate regression model type based on your research question, such as linear regression or multiple regression. Input the necessary data range for analysis and specify the output options you require, including coefficients and statistical significance values. Finally, interpret the regression results carefully to understand the relationship between variables and draw meaningful conclusions from the analysis. By following these steps diligently, users can effectively conduct regression analysis in Excel to uncover valuable insights from their data sets.
Can Excel calculate coefficients and R-squared values for regression analysis?
One frequently asked question regarding regression analysis in Excel is whether the software can calculate coefficients and R-squared values. The answer is yes – Excel provides users with the ability to perform regression analysis and obtain essential statistical outputs, including coefficients and R-squared values. By utilising Excel’s Data Analysis Toolpak, users can easily generate regression results that help quantify the relationships between variables in their datasets. These coefficients indicate the strength and direction of these relationships, while the R-squared value offers insights into how well the model fits the data points, providing a measure of predictive accuracy. Excel’s capability to calculate these key metrics makes it a valuable tool for conducting regression analysis efficiently and effectively.
How can I interpret the results of regression analysis in Excel?
Interpreting the results of regression analysis in Excel is crucial for understanding the relationships between variables and making informed decisions based on the data. When reviewing the output of a regression analysis, it is essential to pay attention to key factors such as coefficients, p-values, and R-squared values. Coefficients indicate the strength and direction of the relationship between variables, while p-values help determine the statistical significance of these relationships. The R-squared value provides insight into how well the model fits the data, with higher values indicating a better fit. By carefully examining these results and considering any assumptions or limitations of the analysis, users can confidently draw meaningful conclusions and leverage regression analysis to drive strategic decision-making processes effectively.
Are there any common pitfalls to avoid when conducting regression analysis in Excel?
When conducting regression analysis in Excel, there are several common pitfalls to be aware of in order to ensure accurate and reliable results. One common pitfall is the misuse of variables, where including irrelevant or correlated variables can lead to multicollinearity issues and distort the interpretation of coefficients. Another pitfall is overlooking assumptions such as linearity, independence, and homoscedasticity, which are essential for the validity of regression models. Additionally, failing to check for outliers or influential data points can skew results and affect the model’s predictive power. It is crucial to address these pitfalls diligently to conduct robust regression analysis in Excel and derive meaningful insights from the data.