The Power of Data Analysis Tools in Excel
Microsoft Excel is a versatile tool that goes beyond simple spreadsheet calculations. With its powerful data analysis tools, Excel allows users to delve deeper into their data, uncover insights, and make informed decisions. Let’s explore some of the key data analysis tools in Excel that can transform the way you work with data.
Pivot Tables
Pivot tables are one of the most popular features in Excel for data analysis. They enable users to summarise and analyse large datasets quickly and efficiently. With pivot tables, you can easily rearrange and summarise your data by dragging and dropping fields, making it easy to identify trends and patterns.
What-If Analysis
Excel’s What-If Analysis tools allow users to explore different scenarios by changing input values and seeing how they affect the results. This feature is particularly useful for forecasting, budgeting, and decision-making processes where understanding the impact of different variables is crucial.
Data Analysis ToolPak
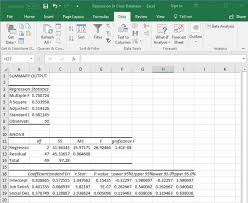
The Data Analysis ToolPak is a collection of powerful statistical tools that extend Excel’s capabilities for data analysis. With features such as regression analysis, histogram creation, and sampling techniques, the ToolPak empowers users to perform complex analyses without needing additional software or expertise.
Conditional Formatting
Conditional formatting in Excel allows users to visually highlight specific data points based on predefined conditions. This feature makes it easy to identify outliers, trends, or anomalies in your dataset at a glance, enhancing data visualisation and interpretation.
Solver
The Solver add-in in Excel enables users to find optimal solutions for complex problems by setting constraints and goals within their dataset. Whether it’s finding the best allocation of resources or maximising profits, Solver helps users optimise their decision-making process based on defined parameters.
Conclusion
Excel’s data analysis tools offer a wide range of functionalities that can significantly enhance your ability to work with data effectively. By leveraging features such as pivot tables, What-If Analysis, Data Analysis ToolPak, conditional formatting, and Solver, you can unlock valuable insights from your datasets and make more informed decisions in your business or personal projects.
Mastering Data Analysis in Excel: 8 Essential Tips for Efficient and Accurate Results
- Use Excel’s built-in functions like SUM, AVERAGE, and COUNT for quick calculations.
- Utilize PivotTables to summarise and analyse data easily.
- Apply filters to focus on specific data points or criteria.
- Use conditional formatting to visualise data patterns and highlight important information.
- Learn how to use VLOOKUP and INDEX-MATCH functions for efficient data retrieval.
- Take advantage of Excel’s Data Validation feature to control input values and ensure data accuracy.
- Explore the ‘What-If Analysis’ tools like Goal Seek and Scenario Manager for predictive analysis.
- Regularly backup your Excel files to prevent data loss.
Use Excel’s built-in functions like SUM, AVERAGE, and COUNT for quick calculations.
Utilising Excel’s built-in functions such as SUM, AVERAGE, and COUNT can significantly streamline your data analysis process. These functions provide a quick and efficient way to perform essential calculations on your dataset without the need for manual calculations. By simply selecting the range of cells you want to analyse and applying these functions, you can instantly obtain the total sum, average value, or count of data points, saving you time and ensuring accuracy in your analyses. Incorporating these fundamental functions into your Excel workflow can enhance your productivity and allow you to focus on interpreting the insights derived from your data.
Utilize PivotTables to summarise and analyse data easily.
By utilising PivotTables in Excel, users can effortlessly summarise and analyse data with ease. PivotTables offer a powerful way to rearrange and summarise large datasets quickly, allowing for the identification of key trends and patterns. This feature simplifies the data analysis process, making it more efficient and enabling users to gain valuable insights from their data in a structured and organised manner.
Apply filters to focus on specific data points or criteria.
By applying filters in Excel, users can effectively narrow down their focus to specific data points or criteria within their datasets. This feature enables users to quickly isolate and analyse relevant information, making it easier to identify trends, patterns, and outliers. By utilising filters, users can streamline their data analysis process and gain valuable insights that drive informed decision-making.
Use conditional formatting to visualise data patterns and highlight important information.
Utilising conditional formatting in Excel can be a powerful technique to visually represent data patterns and emphasise critical information within your dataset. By setting up custom formatting rules based on specific conditions, such as colour-coding cells or applying icons, you can quickly identify trends, outliers, or key insights at a glance. This feature not only enhances the visual appeal of your spreadsheet but also aids in interpreting data more effectively, enabling you to make informed decisions based on the highlighted information.
Learn how to use VLOOKUP and INDEX-MATCH functions for efficient data retrieval.
To enhance your data analysis capabilities in Excel, mastering the VLOOKUP and INDEX-MATCH functions is essential. These powerful tools enable efficient data retrieval by allowing you to search for specific information within your dataset quickly and accurately. By understanding how to use VLOOKUP to search for values in a vertical table or INDEX-MATCH to perform more flexible and dynamic searches, you can streamline your data analysis process and extract the insights you need with precision.
Take advantage of Excel’s Data Validation feature to control input values and ensure data accuracy.
By utilising Excel’s Data Validation feature, users can effectively control input values and maintain data accuracy within their spreadsheets. This tool allows for the creation of custom rules and restrictions on data entry, ensuring that only valid and relevant information is inputted. By implementing Data Validation, users can prevent errors, enforce consistency, and streamline data analysis processes, ultimately leading to more reliable and insightful outcomes from their datasets.
Explore the ‘What-If Analysis’ tools like Goal Seek and Scenario Manager for predictive analysis.
To enhance your data analysis capabilities in Excel, consider exploring the ‘What-If Analysis’ tools such as Goal Seek and Scenario Manager. These tools enable you to conduct predictive analysis by testing different scenarios and variables to understand their impact on outcomes. With Goal Seek, you can set a target result and determine the input value needed to achieve it, providing valuable insights for decision-making. Scenario Manager allows you to create and compare multiple scenarios based on different sets of input values, helping you anticipate potential outcomes and plan accordingly. By utilising these powerful tools, you can enhance your predictive analysis capabilities and make more informed decisions based on data-driven insights.
Regularly backup your Excel files to prevent data loss.
To prevent data loss and ensure the security of your valuable information, it is essential to regularly backup your Excel files. By creating backups of your files at regular intervals, you can safeguard against accidental deletions, software failures, or other unforeseen events that may compromise your data. Implementing a consistent backup routine not only provides peace of mind but also ensures that you can easily recover your data in case of emergencies, allowing you to continue your data analysis work without disruption.


