The Power of SAS Data Analytics
In today’s data-driven world, businesses are constantly seeking ways to extract valuable insights from their data to make informed decisions and gain a competitive edge. This is where SAS data analytics comes into play, offering powerful tools and techniques to analyse and visualise data effectively.
SAS (Statistical Analysis System) is a leading software suite used for advanced analytics, business intelligence, and data management. With its robust capabilities, SAS empowers organisations to uncover hidden patterns, trends, and correlations within their data, enabling them to make strategic decisions with confidence.
Key Features of SAS Data Analytics:
- Advanced Statistical Analysis: SAS provides a wide range of statistical procedures for descriptive and inferential analysis, allowing users to perform complex calculations and hypothesis testing.
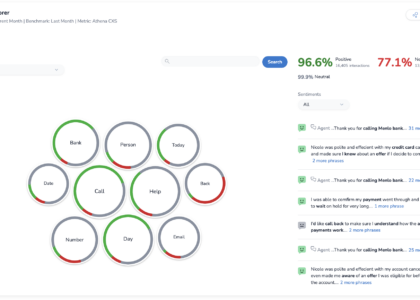
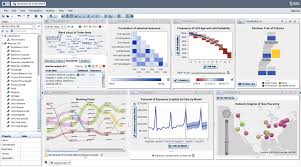
- Data Visualisation: Through interactive graphs, charts, and dashboards, SAS enables users to present data in a visually appealing manner for better understanding and decision-making.
- Machine Learning: SAS offers machine learning algorithms that can be applied to various tasks such as predictive modelling, clustering, and pattern recognition.
- Data Management: With robust data integration and cleansing capabilities, SAS ensures that data quality is maintained throughout the analytics process.
- Scalability: Whether dealing with small datasets or big data environments, SAS can handle large volumes of data efficiently while maintaining high performance.
The Benefits of Using SAS Data Analytics:
By harnessing the power of SAS data analytics, businesses can achieve the following benefits:
- Informed Decision-Making: By gaining deeper insights into their data, organisations can make well-informed decisions that drive business growth and success.
- Improved Efficiency: Automation features in SAS streamline repetitive tasks, saving time and resources for more strategic activities.
- Risk Mitigation: By identifying potential risks and opportunities through analytics, businesses can proactively mitigate risks and capitalise on emerging trends.
- Competitive Advantage: Leveraging advanced analytics gives businesses a competitive edge by enabling them to innovate faster and stay ahead of the curve.
In conclusion, SAS data analytics is a powerful tool that empowers businesses to unlock the full potential of their data. By leveraging advanced statistical analysis, machine learning algorithms, and intuitive visualisation tools offered by SAS, organisations can drive growth, enhance decision-making processes, and stay ahead in today’s dynamic business landscape.
Understanding SAS Data Analytics: Key Questions and Comparisons
- What is SAS data analyst?
- What is SAS full form?
- Who uses SAS analytics?
- Is SAS better than Python?
- What is the difference between Tableau and SAS?
- Is SAS similar to Tableau?
- Is SAS good for data analysis?
- Which is better SAS or python?
What is SAS data analyst?
A SAS data analyst is a professional who specialises in using the SAS (Statistical Analysis System) software suite to analyse and interpret data for meaningful insights. SAS data analysts are skilled in applying statistical techniques, data mining, and machine learning algorithms to extract valuable information from complex datasets. They play a crucial role in helping organisations make informed decisions, identify trends, and solve business challenges through data-driven analysis. With expertise in data management, statistical modelling, and data visualisation, SAS data analysts are instrumental in transforming raw data into actionable intelligence that drives business growth and success.
What is SAS full form?
In the realm of SAS data analytics, a commonly asked question revolves around the full form of SAS. SAS stands for Statistical Analysis System, a comprehensive software suite renowned for its advanced analytics capabilities, data management tools, and business intelligence solutions. Understanding the origin and meaning of the acronym “SAS” provides insight into the powerful functionalities and statistical prowess that underpin this widely used platform in the field of data analytics.
Who uses SAS analytics?
In the realm of SAS data analytics, a common query often arises: “Who uses SAS analytics?” The spectrum of users of SAS analytics is diverse and widespread, encompassing professionals from various industries such as finance, healthcare, marketing, and academia. Data analysts, statisticians, data scientists, business intelligence professionals, and decision-makers within organisations are among the primary beneficiaries of SAS analytics. These users leverage SAS tools and techniques to extract valuable insights from data, make data-driven decisions, drive business growth, enhance operational efficiency, and gain a competitive edge in their respective fields. The versatility and power of SAS analytics cater to a broad audience seeking to harness the potential of data for informed decision-making and strategic planning.
Is SAS better than Python?
When comparing SAS to Python for data analytics, it is essential to consider the specific needs and preferences of the user. SAS is a comprehensive software suite known for its robust statistical analysis capabilities and enterprise-level features. On the other hand, Python is a versatile programming language widely used for data analysis, machine learning, and automation tasks. While SAS offers a user-friendly interface and extensive support for data management, Python provides flexibility, open-source libraries, and a vibrant community of developers. Ultimately, the choice between SAS and Python depends on factors such as the complexity of analysis required, existing infrastructure, budget considerations, and individual expertise in each tool.
What is the difference between Tableau and SAS?
When comparing Tableau and SAS in the realm of data analytics, it is essential to understand their distinct functionalities and strengths. Tableau is primarily a data visualisation tool that excels in creating interactive and visually appealing dashboards to present insights derived from data analysis. On the other hand, SAS is a comprehensive software suite that offers advanced analytics capabilities, including statistical analysis, machine learning, and data management. While Tableau focuses on visual representation of data for easy interpretation, SAS goes beyond visualisation to provide in-depth analytical tools for extracting valuable insights from complex datasets. Both tools serve different purposes in the data analytics process, with Tableau emphasising visual storytelling and SAS offering a robust platform for advanced analytics tasks.
Is SAS similar to Tableau?
When comparing SAS and Tableau in the context of data analytics, it is important to note that they serve different purposes despite some overlapping functionalities. SAS is a comprehensive software suite renowned for its advanced statistical analysis, machine learning capabilities, and data management tools. On the other hand, Tableau is primarily a data visualisation tool that excels in creating interactive and visually engaging charts and dashboards. While both SAS and Tableau can be used in conjunction to enhance data analysis workflows, SAS focuses more on data manipulation and complex statistical modelling, whereas Tableau shines in presenting data in a user-friendly and intuitive manner. Ultimately, the choice between SAS and Tableau depends on the specific requirements of the analytics project at hand.
Is SAS good for data analysis?
When considering the question “Is SAS good for data analysis?”, the answer is a resounding yes. SAS, known for its robust statistical analysis capabilities, advanced data management tools, and comprehensive suite of analytics solutions, is widely regarded as a top choice for data analysis tasks. With its ability to handle large datasets efficiently, perform complex statistical calculations, and provide sophisticated visualisation options, SAS empowers users to extract valuable insights from their data and make informed decisions. Its versatility, scalability, and reliability make it a preferred tool for businesses and organisations seeking to derive meaningful conclusions from their data through in-depth analysis.
Which is better SAS or python?
When comparing SAS and Python for data analytics, the choice often comes down to the specific needs and preferences of the user. SAS is a powerful software suite known for its robust statistical analysis capabilities and enterprise-level support. On the other hand, Python is a versatile programming language with extensive libraries such as Pandas and NumPy that are widely used in data science. While SAS may be preferred for its user-friendly interface and comprehensive features, Python’s flexibility, open-source nature, and strong community support make it a popular choice among data analysts and developers. Ultimately, the decision between SAS and Python depends on factors like project requirements, familiarity with the tools, and organisational preferences.