Top Data Analytics Tools
Data analytics tools have become essential for businesses looking to make informed decisions based on data-driven insights. With the vast amount of data available today, these tools play a crucial role in analysing and interpreting information to drive business growth and success. Here are some of the top data analytics tools that are widely used across industries:
Tableau
Tableau is a powerful data visualization tool that allows users to create interactive and shareable dashboards. It enables users to explore data visually and uncover insights that may not be apparent through traditional data analysis methods.
Microsoft Power BI
Microsoft Power BI is a business analytics tool that provides interactive visualizations and business intelligence capabilities. It allows users to connect to multiple data sources, create reports and dashboards, and share insights with stakeholders.
Google Analytics
Google Analytics is a web analytics service that tracks and reports website traffic. It provides valuable insights into user behaviour, conversion rates, and other key metrics that help businesses understand their online presence better.
Python with Pandas
Python, along with the Pandas library, is widely used for data manipulation and analysis. It offers powerful tools for cleaning, transforming, and analysing data sets efficiently, making it a popular choice among data scientists and analysts.
IBM Watson Analytics
IBM Watson Analytics is an advanced analytics platform that uses artificial intelligence to uncover patterns and insights in data sets. It simplifies complex data analysis tasks and helps users generate actionable insights quickly.
These are just a few of the top data analytics tools available in the market today. Each tool offers unique features and capabilities tailored to different user needs. By leveraging these tools effectively, businesses can harness the power of their data to drive growth, innovation, and competitive advantage.
Mastering Data Analytics: 9 Essential Tools and Tips for Success
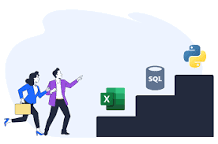
- Familiarise yourself with Excel for basic data analysis and visualisation tasks.
- Learn SQL to efficiently query and manipulate large datasets in databases.
- Explore Python libraries like Pandas and NumPy for powerful data manipulation capabilities.
- Use R for statistical analysis, especially if you need advanced modelling techniques.
- Get comfortable with Tableau or Power BI for creating interactive dashboards and reports.
- Understand the basics of Google Analytics to track website performance metrics effectively.
- Consider using Apache Spark for big data processing across distributed systems.
- Experiment with Jupyter Notebooks as an environment for documenting and sharing analyses.
- Stay updated on new features in your chosen tools to maximise their potential.
Familiarise yourself with Excel for basic data analysis and visualisation tasks.
To excel in basic data analysis and visualisation tasks, it is essential to familiarise yourself with Excel. Excel provides a user-friendly platform for manipulating and visualising data, making it a valuable tool for beginners in the field of data analytics. By mastering Excel’s functions and features, individuals can efficiently organise data, perform calculations, and create simple visualisations to gain insights from their datasets. This foundational knowledge of Excel lays the groundwork for more advanced data analytics tools and techniques, setting a solid foundation for further exploration and learning in the field.
Learn SQL to efficiently query and manipulate large datasets in databases.
To effectively utilise top data analytics tools, it is highly recommended to learn SQL, a powerful language used for querying and manipulating large datasets within databases. SQL proficiency enables analysts and data scientists to extract specific information, perform complex calculations, and generate valuable insights from vast amounts of data. By mastering SQL, users can streamline data analysis processes, enhance efficiency, and unlock the full potential of their chosen analytics tools when working with extensive datasets.
Explore Python libraries like Pandas and NumPy for powerful data manipulation capabilities.
To enhance your data analytics capabilities, consider exploring Python libraries such as Pandas and NumPy. These powerful tools offer a wide range of functions for data manipulation, cleaning, and analysis. With Pandas, you can efficiently handle large datasets and perform complex operations, while NumPy provides support for mathematical functions and array operations. By leveraging these libraries in your data analytics workflow, you can streamline processes and uncover valuable insights from your data more effectively.
Use R for statistical analysis, especially if you need advanced modelling techniques.
When it comes to statistical analysis and advanced modelling techniques, utilising R can be a game-changer. R is a powerful programming language and software environment specifically designed for statistical computing and graphics. With its extensive library of packages tailored for data analysis, R provides a comprehensive set of tools for conducting complex statistical analyses, building predictive models, and visualising data effectively. By leveraging R for your data analytics needs, you can unlock a wealth of capabilities to enhance decision-making and gain deeper insights from your data.
Get comfortable with Tableau or Power BI for creating interactive dashboards and reports.
To maximise the potential of data analytics, it is essential to become proficient in tools like Tableau or Power BI for developing interactive dashboards and reports. These platforms offer intuitive interfaces and robust functionalities that enable users to visualise data effectively and extract valuable insights. By mastering Tableau or Power BI, businesses can streamline their data analysis processes, communicate findings more efficiently, and make informed decisions based on clear, interactive visualisations. Embracing these tools can significantly enhance the way organisations leverage data to drive growth and stay competitive in today’s data-driven landscape.
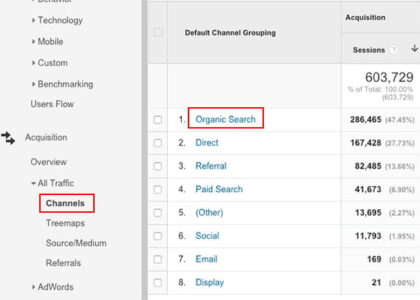
Understand the basics of Google Analytics to track website performance metrics effectively.
Understanding the basics of Google Analytics is crucial for tracking website performance metrics effectively. By familiarising yourself with this powerful web analytics tool, you can gain valuable insights into user behaviour, traffic sources, conversion rates, and other key metrics that impact your online presence. With a solid grasp of Google Analytics, you can make informed decisions to optimise your website, improve user experience, and ultimately drive better results for your business.
Consider using Apache Spark for big data processing across distributed systems.
When exploring top data analytics tools, a valuable tip to consider is leveraging Apache Spark for big data processing across distributed systems. Apache Spark is a powerful open-source framework that offers high-speed data processing capabilities, making it ideal for handling large volumes of data efficiently. By utilising Apache Spark, businesses can enhance their data analytics operations, improve scalability, and achieve faster processing speeds across distributed environments. This tool is particularly beneficial for organisations dealing with massive datasets and seeking to streamline their big data processing workflows effectively.
Experiment with Jupyter Notebooks as an environment for documenting and sharing analyses.
Experimenting with Jupyter Notebooks as an environment for documenting and sharing analyses can greatly enhance the data analytics process. Jupyter Notebooks provide a user-friendly platform where data scientists and analysts can write code, visualize data, and include explanatory text all in one interactive document. This not only streamlines the analysis workflow but also makes it easier to share findings with colleagues or stakeholders. By utilising Jupyter Notebooks, teams can collaborate more efficiently, reproduce analyses easily, and create a more transparent and reproducible analytical environment.
Stay updated on new features in your chosen tools to maximise their potential.
Staying updated on new features in your chosen data analytics tools is essential to maximise their potential. By keeping abreast of the latest developments and enhancements, you can take full advantage of advanced functionalities and capabilities that can significantly enhance your data analysis processes. Embracing new features allows you to stay ahead of the curve, adapt to evolving trends, and leverage cutting-edge technologies to extract deeper insights from your data. Continuous learning and exploration of new tool features ensure that you are optimising your data analytics tools to their fullest extent, empowering you to make more informed decisions and drive business growth effectively.