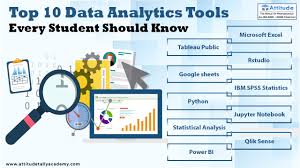
The Power of Data Analysis
Data analysis is a crucial process that involves inspecting, cleansing, transforming, and modelling data to uncover meaningful insights, inform decision-making, and drive business success. In today’s data-driven world, the ability to effectively analyse data has become a key competitive advantage for organisations across industries.
Why Data Analysis Matters
By harnessing the power of data analysis, businesses can gain valuable insights into their operations, customer behaviour, market trends, and more. These insights enable informed decision-making that can lead to improved efficiency, increased profitability, and sustainable growth.
The Process of Data Analysis
Data analysis typically involves several key steps:
- Data Collection: Gathering relevant data from various sources.
- Data Cleaning: Removing inconsistencies and errors in the data.
- Data Exploration: Exploring the data to identify patterns and trends.
- Data Modelling: Applying statistical techniques or machine learning algorithms to extract insights.
- Interpretation: Interpreting the results to make informed decisions.
The Role of Technology in Data Analysis
Advancements in technology have revolutionised the field of data analysis. Tools such as data visualisation software, predictive analytics platforms, and artificial intelligence have made it easier than ever to process large volumes of data quickly and accurately. These technologies empower businesses to unlock the full potential of their data assets.
Conclusion
In conclusion, data analysis is a powerful tool that can drive business growth and innovation. By investing in robust data analysis processes and leveraging cutting-edge technologies, organisations can stay ahead of the competition and make strategic decisions based on evidence rather than intuition. Embracing the power of data analysis is essential for success in today’s fast-paced digital landscape.
Six Essential Tips for Effective Data Analysis
- Ensure data quality by cleaning and validating your datasets.
- Define clear objectives and hypotheses before starting the analysis.
- Use visualisations to present data in a clear and insightful manner.
- Consider using statistical tools and techniques to derive meaningful insights.
- Document your analysis process and findings for future reference.
- Regularly review and validate your analysis results to ensure accuracy.
Ensure data quality by cleaning and validating your datasets.
To ensure the accuracy and reliability of your data analysis, it is essential to prioritise data quality by thoroughly cleaning and validating your datasets. By identifying and rectifying inconsistencies, errors, and missing values in the data, you can enhance the integrity of your analysis results and make more informed decisions based on reliable information. Validating the data through rigorous checks and verification processes further ensures that the insights derived are trustworthy and actionable, ultimately leading to more effective strategies and outcomes for your business.
Define clear objectives and hypotheses before starting the analysis.
Defining clear objectives and hypotheses before commencing data analysis is a fundamental tip that can significantly enhance the effectiveness of the analytical process. By establishing specific goals and formulating hypotheses upfront, analysts can focus their efforts on extracting relevant insights that directly contribute to achieving desired outcomes. This approach not only provides a structured framework for the analysis but also ensures that the results obtained are actionable and aligned with the overarching objectives of the project. Clarity in objectives and hypotheses sets a solid foundation for a successful data analysis endeavour, guiding researchers towards meaningful conclusions and informed decision-making.
Use visualisations to present data in a clear and insightful manner.
Utilising visualisations to present data is a valuable tip in data analysis. Visual representations such as charts, graphs, and infographics can transform complex datasets into easily digestible and insightful information. By incorporating visual elements, analysts can effectively communicate trends, patterns, and relationships within the data, enabling stakeholders to make informed decisions with clarity. Visualisations not only enhance data interpretation but also engage audiences more effectively, making the analytical process more accessible and impactful.
Consider using statistical tools and techniques to derive meaningful insights.
When analysing data, it is highly beneficial to consider employing statistical tools and techniques to extract valuable insights. By utilising statistical methods, such as regression analysis, hypothesis testing, or clustering algorithms, businesses can uncover patterns, correlations, and trends within their data that may not be immediately apparent. These tools enable data analysts to make informed decisions based on quantitative evidence, leading to more accurate predictions and strategic planning. Incorporating statistical approaches in data analysis enhances the depth and reliability of the insights gained, ultimately contributing to better outcomes for organisations.
Document your analysis process and findings for future reference.
It is essential to document your analysis process and findings for future reference. By keeping detailed records of how you conducted your analysis, the methodologies you employed, and the insights you uncovered, you create a valuable resource that can be referred back to in the future. Documenting your analysis process not only helps ensure transparency and reproducibility but also enables you or others to build upon previous work, track progress, and make informed decisions based on past findings. This practice fosters a culture of continuous improvement and empowers data-driven decision-making within an organisation.
Regularly review and validate your analysis results to ensure accuracy.
Regularly reviewing and validating your analysis results is essential to ensure the accuracy and reliability of your findings. By conducting regular checks and validations, you can identify any potential errors or inconsistencies in the data analysis process, ultimately leading to more robust and trustworthy insights. This practice not only enhances the quality of your decision-making but also helps maintain the integrity of your data-driven strategies over time.


