The Power of Statistical Analyses in Data Interpretation
Statistical analyses play a crucial role in the field of data interpretation, providing valuable insights and understanding from raw data. By using statistical methods, researchers and analysts can uncover patterns, trends, and relationships within datasets that might otherwise remain hidden. Let’s explore the significance of statistical analyses in extracting meaningful information from data.
Understanding Variation
One of the fundamental aspects of statistical analyses is to understand and quantify variation within a dataset. By calculating measures such as mean, median, variance, and standard deviation, analysts can gain an overview of the distribution of data points. This information is essential for making informed decisions and drawing reliable conclusions.
Hypothesis Testing
Statistical analyses enable researchers to test hypotheses and determine the significance of relationships between variables. Through methods like t-tests, ANOVA, and regression analysis, analysts can assess whether observed differences or associations are statistically significant or simply due to chance. This helps in validating research findings and making reliable predictions.
Data Modelling
Statistical modelling allows analysts to create predictive models based on existing data. Techniques such as linear regression, logistic regression, and time series analysis help in forecasting future trends, identifying key drivers of outcomes, and understanding complex relationships between variables. These models provide a basis for decision-making and planning strategies.
Quality Control
Statistical analyses are vital for quality control processes in various industries. By analysing process data using control charts, hypothesis tests, and capability analysis, organisations can monitor production processes, detect deviations from standards, and implement corrective actions to improve quality and efficiency. Statistical tools help in maintaining consistency and reliability in operations.
Data Visualisation
Visual representation of data through graphs, charts, and plots is an integral part of statistical analyses. Visualisation techniques such as histograms, scatter plots, box plots, and heat maps help in presenting complex information in a clear and understandable manner. Visualisations aid in communicating findings effectively to stakeholders and facilitating decision-making based on data-driven insights.
The Future of Statistical Analyses
In the era of big data and advanced analytics technologies like machine learning and artificial intelligence (AI), the role of statistical analyses continues to evolve. Integrating traditional statistical methods with modern tools allows for more sophisticated analysis of complex datasets with high dimensionality. The future promises exciting opportunities for leveraging statistical techniques to extract knowledge from vast amounts of data.
In conclusion, statistical analyses are indispensable tools for interpreting data effectively across various domains. From exploring patterns within datasets to making informed decisions based on evidence-backed insights, statistical methods empower researchers and analysts to derive meaningful conclusions from raw information. Embracing the power of statistical analyses opens doors to new discoveries and innovations driven by the transformative potential of data interpretation.
Understanding Statistical Analysis: Answers to 7 Common Questions
- What do you mean by statistical analysis?
- What are examples of statistical analysis?
- What does a statistical analyst do?
- What are the 5 basic statistical analysis?
- What are the 4 methods of statistical analysis?
- What are different types of statistical analyses?
- What are the types of statistical analysis?
What do you mean by statistical analysis?
Statistical analysis refers to the process of collecting, exploring, and interpreting data using statistical methods to draw meaningful conclusions and make informed decisions. It involves applying various techniques to summarise and describe data, test hypotheses, identify patterns and trends, and create predictive models. Statistical analysis plays a vital role in research, business analytics, quality control, and decision-making across different fields. By utilising statistical tools and methodologies, analysts can uncover valuable insights from data that help in understanding relationships between variables, making accurate predictions, and driving evidence-based strategies for success.
What are examples of statistical analysis?
Statistical analysis encompasses a wide range of techniques and methods used to interpret data and draw meaningful conclusions. Some common examples of statistical analyses include hypothesis testing, regression analysis, analysis of variance (ANOVA), chi-square tests, correlation analysis, and cluster analysis. These techniques are applied in various fields such as economics, psychology, healthcare, marketing, and social sciences to explore relationships between variables, make predictions, test hypotheses, and derive insights from data. Each type of statistical analysis serves a specific purpose in uncovering patterns and trends within datasets, guiding decision-making processes based on evidence-based findings.
What does a statistical analyst do?
A statistical analyst plays a vital role in interpreting data by applying various statistical methods to uncover patterns, trends, and relationships within datasets. Their primary responsibility involves collecting, processing, and analysing data to extract meaningful insights that inform decision-making processes. Statistical analysts design experiments, conduct hypothesis tests, build predictive models, and present findings through visualisations to communicate complex information effectively. By utilising their expertise in statistical techniques and data interpretation, statistical analysts help organisations make informed decisions, identify opportunities for improvement, and drive innovation through evidence-based insights.
What are the 5 basic statistical analysis?
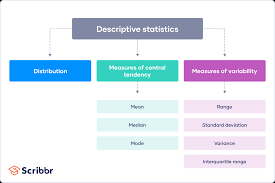
In the realm of statistical analyses, there are five fundamental techniques that form the cornerstone of data interpretation: descriptive statistics, inferential statistics, regression analysis, hypothesis testing, and correlation analysis. Descriptive statistics involve summarising and presenting data using measures such as mean, median, and standard deviation. Inferential statistics allow researchers to draw conclusions about a population based on sample data. Regression analysis examines the relationship between variables, while hypothesis testing evaluates the significance of findings. Correlation analysis explores the strength and direction of relationships between variables. These five basic statistical analyses serve as essential tools for researchers and analysts in uncovering insights and making informed decisions based on data-driven evidence.
What are the 4 methods of statistical analysis?
Statistical analysis encompasses a variety of methods used to interpret and draw conclusions from data. Four commonly employed methods in statistical analysis include descriptive statistics, inferential statistics, exploratory data analysis, and predictive modelling. Descriptive statistics involve summarising and presenting data using measures such as mean, median, and standard deviation. Inferential statistics focus on making inferences about a population based on sample data through hypothesis testing and confidence intervals. Exploratory data analysis aims to uncover patterns and relationships within datasets using visualisation techniques like scatter plots and histograms. Predictive modelling utilises statistical algorithms to forecast future outcomes based on historical data patterns. These four methods form the foundation of statistical analysis, providing valuable tools for extracting insights and making informed decisions from diverse datasets.
What are different types of statistical analyses?
Statistical analyses encompass a diverse range of methods and techniques used to interpret data and draw meaningful conclusions. Some common types of statistical analyses include descriptive statistics, which summarise and describe the characteristics of a dataset; inferential statistics, which help in making predictions and drawing inferences about a population based on sample data; hypothesis testing, which assesses the significance of relationships between variables; regression analysis, which explores the relationship between dependent and independent variables; and ANOVA (Analysis of Variance), which compares means across multiple groups. Each type of statistical analysis serves a specific purpose in uncovering patterns, trends, and relationships within data sets, providing valuable insights for decision-making and research purposes.
What are the types of statistical analysis?
Statistical analysis encompasses a wide range of techniques used to interpret and draw conclusions from data. There are several types of statistical analyses, each serving a specific purpose in data interpretation. Descriptive statistics, such as mean, median, and standard deviation, summarise and describe the characteristics of a dataset. Inferential statistics involve making predictions or inferences about a population based on sample data through methods like hypothesis testing and regression analysis. Multivariate analysis examines relationships between multiple variables simultaneously, while time series analysis focuses on analysing data collected over time to identify trends and patterns. Experimental design and non-parametric methods are also important types of statistical analyses used in various research contexts. Each type of statistical analysis plays a unique role in extracting valuable insights from data to inform decision-making and research outcomes.