Statistical Analysis Using Python
In the world of data science and analytics, Python has emerged as a powerful tool for conducting statistical analysis. With its extensive libraries such as NumPy, Pandas, and Matplotlib, Python provides a versatile platform for handling data and deriving meaningful insights.
Data Manipulation with Pandas
Pandas is a popular library in Python for data manipulation and analysis. It offers data structures like DataFrames that allow users to easily load, clean, and transform datasets. By using Pandas, analysts can perform tasks such as filtering data, grouping information, and merging datasets seamlessly.
Numerical Computing with NumPy
NumPy is another essential library in Python that provides support for large multi-dimensional arrays and matrices along with a collection of mathematical functions to operate on these arrays efficiently. With NumPy, statisticians can perform various numerical computations like mean, median, standard deviation, and more with ease.
Data Visualization with Matplotlib
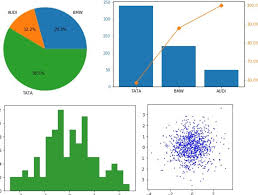
Visualising data is crucial in statistical analysis to understand patterns and trends effectively. Matplotlib is a powerful plotting library in Python that enables users to create various types of graphs such as histograms, scatter plots, bar charts, and more. By visualising data using Matplotlib, analysts can communicate their findings clearly.
Hypothesis Testing and Regression Analysis
Python also offers libraries like SciPy and StatsModels that facilitate hypothesis testing and regression analysis. Analysts can conduct statistical tests to validate hypotheses or build regression models to explore relationships between variables. These tools empower users to make informed decisions based on robust statistical evidence.
Conclusion
Statistical analysis using Python has revolutionised the way data scientists approach complex datasets. By leveraging the rich ecosystem of libraries available in Python, analysts can perform a wide range of statistical tasks efficiently. From data manipulation to visualization and hypothesis testing, Python equips users with the tools they need to extract valuable insights from data.
Frequently Asked Questions about Statistical Analysis Using Python
- What is the Python tool for data analysis?
- What is the use of statistics in Python?
- Can Python be used for statistical analysis?
- How to data analysis using Python?
What is the Python tool for data analysis?
When it comes to data analysis, Python offers a versatile and powerful tool known as Pandas. Pandas is a widely-used library in Python that provides data structures like DataFrames, enabling analysts to efficiently manipulate, clean, and analyse datasets. With its intuitive functions and capabilities, Pandas simplifies tasks such as data filtering, grouping, and merging, making it an essential tool for conducting comprehensive data analysis in Python.
What is the use of statistics in Python?
Statistics plays a crucial role in Python by providing a systematic framework for analysing and interpreting data. In the context of Python, statistics are utilised to uncover patterns, trends, and relationships within datasets, enabling data scientists and analysts to make informed decisions. By employing statistical techniques in Python, users can perform tasks such as hypothesis testing, regression analysis, and data visualisation to extract meaningful insights from complex data structures. Ultimately, the use of statistics in Python enhances the accuracy and reliability of analytical processes, empowering individuals to derive valuable conclusions and drive evidence-based decision-making.
Can Python be used for statistical analysis?
Yes, Python is widely used for statistical analysis due to its robust libraries and tools tailored for data manipulation, numerical computing, and data visualization. With libraries such as Pandas, NumPy, and Matplotlib, Python provides a comprehensive ecosystem that supports various statistical tasks. From cleaning and transforming datasets to conducting hypothesis testing and regression analysis, Python offers a versatile platform for statisticians and data scientists to derive meaningful insights from data efficiently. Its flexibility, ease of use, and extensive community support make Python a popular choice for statistical analysis in diverse fields such as research, business analytics, and machine learning.
How to data analysis using Python?
When it comes to conducting data analysis using Python, a common question that arises is, “How to perform data analysis using Python?” Data analysis in Python involves leveraging various libraries such as Pandas, NumPy, and Matplotlib to manipulate, explore, and visualise datasets effectively. Analysts typically start by loading the data into a Pandas DataFrame, where they can clean and preprocess the data. They then use NumPy for numerical computations and statistical operations. Visualising the data using Matplotlib helps analysts gain insights and communicate their findings clearly. By following a systematic approach with Python libraries, individuals can conduct comprehensive data analysis that leads to valuable insights and informed decision-making.


