The Importance of Descriptive Analysis in Quantitative Research
Quantitative research involves the collection and analysis of numerical data to understand patterns, trends, and relationships within a given population or sample. One crucial aspect of quantitative research is descriptive analysis, which plays a fundamental role in summarising and interpreting data.
What is Descriptive Analysis?
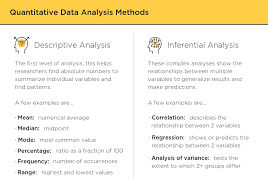
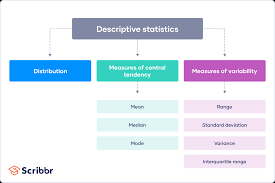
Descriptive analysis is the process of organising, summarising, and presenting data in a meaningful way. It involves using statistical measures such as mean, median, mode, standard deviation, and range to describe the characteristics of a dataset. By providing a clear overview of the data, descriptive analysis helps researchers identify key insights and trends.
The Role of Descriptive Analysis
Descriptive analysis serves several important functions in quantitative research:
- Data Summarisation: Descriptive statistics help researchers condense large datasets into manageable summaries without losing essential information.
- Data Exploration: By examining central tendencies and variability in the data, researchers can identify patterns and outliers that may require further investigation.
- Data Comparison: Descriptive analysis allows for comparisons between different groups or variables within the dataset to uncover relationships or differences.
- Data Interpretation: Through descriptive statistics, researchers can interpret the meaning of their findings and draw conclusions based on empirical evidence.
Common Descriptive Statistics
Some common descriptive statistics used in quantitative research include:
- Mean: The average value of a dataset.
- Median: The middle value when data is arranged in ascending order.
- Mode: The most frequently occurring value in a dataset.
- Standard Deviation: A measure of how spread out values are from the mean.
- Range: The difference between the highest and lowest values in a dataset.
In Conclusion
In quantitative research, descriptive analysis is an essential tool for understanding and interpreting numerical data. By providing meaningful summaries and insights into datasets, descriptive statistics enable researchers to make informed decisions and draw valid conclusions based on empirical evidence.
Five Essential Tips for Effective Descriptive Analysis in Quantitative Research
- Ensure that the data is accurately recorded and entered for analysis.
- Use appropriate descriptive statistics such as mean, median, mode, standard deviation, and range to summarise the data.
- Present your findings using tables, charts, and graphs to enhance clarity and understanding.
- Check for outliers or anomalies in the data that may impact the interpretation of results.
- Provide a detailed description of the sample characteristics to give context to the findings.
Ensure that the data is accurately recorded and entered for analysis.
It is crucial to ensure that the data is accurately recorded and entered for analysis when conducting descriptive analysis in quantitative research. Accurate data entry is the foundation of reliable results, as any errors or inconsistencies in the data can lead to misleading conclusions. By maintaining meticulous records and double-checking data entry processes, researchers can enhance the validity and integrity of their findings, ultimately contributing to the overall quality of the research outcomes.
Use appropriate descriptive statistics such as mean, median, mode, standard deviation, and range to summarise the data.
When conducting descriptive analysis in quantitative research, it is essential to utilise appropriate descriptive statistics to effectively summarise the data. Key measures such as the mean, median, mode, standard deviation, and range play a crucial role in providing a comprehensive overview of the dataset. By incorporating these statistical measures, researchers can gain valuable insights into the central tendencies, variability, and distribution of the data, enabling them to make informed interpretations and draw meaningful conclusions based on empirical evidence.
Present your findings using tables, charts, and graphs to enhance clarity and understanding.
To enhance clarity and understanding of your findings in quantitative research, it is advisable to present your results using tables, charts, and graphs. Visual representations such as bar graphs, pie charts, scatter plots, and histograms can effectively summarise complex data and trends in a way that is easily digestible for both researchers and readers. By utilising visual aids alongside descriptive analysis, you can provide a comprehensive overview of your research findings, making it easier for others to interpret and draw insights from the data presented.
Check for outliers or anomalies in the data that may impact the interpretation of results.
When conducting descriptive analysis in quantitative research, it is crucial to check for outliers or anomalies in the data that could potentially influence the interpretation of results. Outliers are data points that significantly deviate from the rest of the dataset and can skew statistical measures such as the mean or standard deviation. By identifying and addressing outliers, researchers can ensure that their analysis is more accurate and reliable, leading to more robust conclusions and insights derived from the data.
Provide a detailed description of the sample characteristics to give context to the findings.
Providing a detailed description of the sample characteristics is a crucial tip in descriptive analysis for quantitative research. By clearly outlining the demographic information, such as age, gender, education level, and other relevant variables of the participants in a study, researchers can establish context for their findings. Understanding the sample characteristics allows researchers to interpret the data more accurately and draw meaningful conclusions based on how different subgroups within the sample may have influenced the results. This practice enhances the transparency and credibility of the research findings, providing valuable insights into the generalisability and applicability of the study outcomes.


