The Power of Time Series Analysis in Statistics
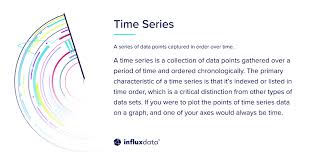
Time series analysis is a statistical technique that deals with data points collected, recorded, or observed over a period of time. It is a powerful tool used in various fields such as economics, finance, weather forecasting, and signal processing to understand patterns, trends, and relationships within the data.
Key Concepts
One of the fundamental concepts in time series analysis is the idea of time dependence. Data points in a time series are often correlated with previous observations, making them non-independent. This time dependence can reveal valuable insights into the underlying processes generating the data.
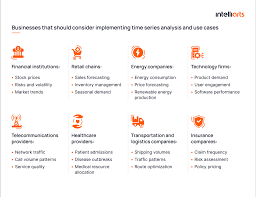
Applications
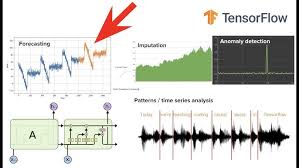
Time series analysis is widely used in forecasting future values based on historical data. In finance, for example, it can be used to predict stock prices or currency exchange rates. In meteorology, it helps forecast weather patterns and trends. Moreover, in signal processing, it can be utilised to analyse and filter signals to extract useful information.
Techniques
There are various techniques employed in time series analysis. One common method is moving average, where data points are averaged over a sliding window to smooth out fluctuations and highlight trends. Autoregressive Integrated Moving Average (ARIMA) models are another popular approach that combines autoregressive and moving average components to model complex time series data.
Challenges
Despite its usefulness, time series analysis comes with challenges. Time series data can exhibit seasonality (repeating patterns at regular intervals), trends (long-term movements), and irregular fluctuations that make analysis complex. Handling missing data points or outliers also poses challenges that require careful consideration.
Conclusion
In conclusion, time series analysis is a valuable statistical tool for understanding and predicting patterns in sequential data. By leveraging techniques such as moving averages and ARIMA models, analysts can uncover hidden insights and make informed decisions based on historical trends. As technology advances and datasets grow larger, the importance of time series analysis in statistics continues to grow across various industries.
Essential Tips for Effective Time Series Analysis in Statistics
- Ensure your time series data is stationary before applying statistical models.
- Use visualisation techniques like time plots and autocorrelation plots to understand patterns in the data.
- Consider seasonality and trends in your analysis to account for periodic patterns.
- Test different forecasting models such as ARIMA, Exponential Smoothing, or Prophet to find the best fit for your data.
- Validate your model using techniques like cross-validation to assess its predictive performance.
Ensure your time series data is stationary before applying statistical models.
To ensure the accuracy and reliability of your time series analysis, it is crucial to first ensure that your time series data is stationary before applying statistical models. Stationarity in time series data means that the statistical properties such as mean, variance, and autocorrelation remain constant over time. By transforming non-stationary data into a stationary form, you can avoid misleading results and improve the effectiveness of statistical models in capturing meaningful patterns and relationships within the data. This pre-processing step is essential for obtaining accurate insights and making informed decisions based on reliable analysis results.
Use visualisation techniques like time plots and autocorrelation plots to understand patterns in the data.
When conducting time series analysis in statistics, it is essential to utilise visualisation techniques such as time plots and autocorrelation plots to gain a deeper understanding of the patterns present in the data. Time plots provide a visual representation of how data points evolve over time, allowing analysts to identify trends, seasonality, and irregular fluctuations. Autocorrelation plots, on the other hand, help reveal the correlation between each data point and its lagged values, providing insights into the presence of dependencies within the time series. By incorporating these visualisation techniques into the analysis process, researchers can effectively uncover patterns and relationships that may not be apparent through numerical analysis alone.
Consider seasonality and trends in your analysis to account for periodic patterns.
When conducting time series analysis in statistics, it is crucial to consider seasonality and trends in your data to account for periodic patterns that may exist. Seasonality refers to recurring patterns or fluctuations that follow a specific time frame, such as daily, weekly, or yearly cycles. By identifying and accounting for seasonality in your analysis, you can better understand the impact of these regular patterns on your data and make more accurate forecasts or predictions. Similarly, trends represent long-term movements or changes in the data over time, which can provide valuable insights into underlying patterns or behaviours. By incorporating seasonality and trends into your analysis, you can uncover important information and ensure that your statistical models capture the full complexity of the data.
Test different forecasting models such as ARIMA, Exponential Smoothing, or Prophet to find the best fit for your data.
To optimise the accuracy of time series forecasting, it is advisable to experiment with various forecasting models such as ARIMA, Exponential Smoothing, or Prophet. By testing different models and comparing their performance against your data, you can identify the most suitable model that provides the best fit and predictive power. Each of these models has its strengths and limitations, so exploring multiple options can help you choose the most effective approach for analysing and forecasting your time series data accurately.
Validate your model using techniques like cross-validation to assess its predictive performance.
To enhance the reliability of your time series analysis model, it is crucial to validate its predictive performance using techniques such as cross-validation. Cross-validation involves partitioning the data into subsets, training the model on one subset, and testing it on another. By assessing how well the model generalises to unseen data through cross-validation, you can gain valuable insights into its predictive accuracy and robustness. This validation step is essential in ensuring that your time series analysis model is not overfitting to the training data and can effectively forecast future values with confidence.