Statistical Analysis of Survey Data
In the realm of research and data analysis, surveys are a valuable tool for collecting information from a sample population. However, the real power lies in the statistical analysis of survey data, which can unveil meaningful insights and trends that inform decision-making processes.
Data Cleaning and Preparation
Before diving into statistical analysis, it is crucial to clean and prepare the survey data. This involves checking for missing values, outliers, and inconsistencies that could skew the results. By ensuring data integrity, researchers can trust the accuracy of their findings.
Descriptive Statistics
Descriptive statistics provide a summary of the survey data through measures such as mean, median, mode, standard deviation, and range. These statistics offer a snapshot of the central tendencies and variability within the dataset, giving researchers an initial understanding of the data distribution.
Inferential Statistics
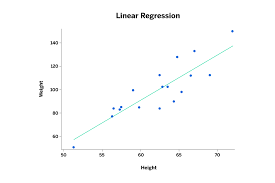
Once descriptive statistics have been examined, researchers can move on to inferential statistics to draw conclusions about the larger population based on the survey sample. Techniques such as hypothesis testing, regression analysis, and correlation help uncover relationships between variables and make predictions about future outcomes.
Data Visualisation
Data visualisation plays a crucial role in presenting survey findings in a clear and accessible manner. Charts, graphs, and other visual aids can help communicate complex statistical analyses to stakeholders effectively. Visual representations enhance understanding and facilitate decision-making based on survey results.
Interpreting Results
The final step in statistical analysis is interpreting the results derived from survey data. Researchers must contextualise their findings within the broader research objectives and draw actionable insights that drive meaningful outcomes. Effective interpretation ensures that survey data is leveraged to its full potential.
Conclusion
Statistical analysis of survey data is a powerful tool for extracting valuable insights from collected information. By employing rigorous analytical techniques and interpreting results thoughtfully, researchers can unlock patterns, trends, and relationships that inform strategic decision-making processes across various fields.
Understanding the Statistical Analysis of Survey Data: Key Questions and Insights
- What is statistical analysis of survey data?
- Why is statistical analysis important in survey data?
- What are the steps involved in statistical analysis of survey data?
- How do you clean and prepare survey data for statistical analysis?
- What are descriptive statistics and why are they used in survey data analysis?
- What is the difference between descriptive and inferential statistics in survey data analysis?
- How can visualisation techniques enhance the presentation of statistical findings from survey data?
What is statistical analysis of survey data?
Statistical analysis of survey data involves the application of mathematical and statistical techniques to examine and interpret the information gathered from surveys. It allows researchers to uncover patterns, trends, relationships, and insights within the dataset that can inform decision-making processes. By utilising descriptive and inferential statistics, researchers can summarise the data, test hypotheses, identify correlations between variables, and make predictions based on the survey sample. Ultimately, statistical analysis of survey data plays a crucial role in transforming raw data into meaningful information that guides strategic actions and drives informed outcomes.
Why is statistical analysis important in survey data?
Statistical analysis is crucial in survey data as it provides a systematic and objective method for interpreting the information collected. By applying statistical techniques to survey data, researchers can uncover patterns, trends, and relationships that may not be immediately apparent. This analysis helps in making sense of the data, identifying key insights, and drawing meaningful conclusions. Statistical analysis also enables researchers to test hypotheses, make predictions, and generalise findings to a larger population. Ultimately, statistical analysis adds rigour and reliability to survey results, ensuring that decisions and actions are based on sound evidence rather than intuition or anecdotal observations.
What are the steps involved in statistical analysis of survey data?
When considering the statistical analysis of survey data, several key steps must be followed to derive meaningful insights. Firstly, data cleaning and preparation are essential to ensure the accuracy and integrity of the dataset. Descriptive statistics provide an initial summary of the data’s central tendencies and variability, offering a foundational understanding. Moving on to inferential statistics allows researchers to make inferences about the larger population based on the survey sample, utilising techniques such as hypothesis testing and regression analysis. Data visualisation plays a crucial role in presenting findings effectively through charts and graphs. Finally, interpreting results is vital to contextualise findings within the research objectives and draw actionable insights that drive informed decision-making processes. By following these steps diligently, researchers can unlock valuable insights from survey data for various applications.
How do you clean and prepare survey data for statistical analysis?
In the process of preparing survey data for statistical analysis, thorough data cleaning is essential to ensure the accuracy and reliability of the results. Cleaning survey data involves several crucial steps, including identifying and handling missing values, detecting and addressing outliers that may skew the analysis, checking for inconsistencies or errors in responses, and standardising variables for uniformity. By meticulously reviewing and rectifying any discrepancies within the dataset, researchers can establish a solid foundation for robust statistical analysis that yields meaningful insights and informs evidence-based decision-making processes.
What are descriptive statistics and why are they used in survey data analysis?
Descriptive statistics are numerical measures that summarise and describe the characteristics of a dataset in survey data analysis. They provide a concise overview of key features such as central tendency, variability, and distribution within the data. Descriptive statistics, including measures like mean, median, mode, and standard deviation, help researchers gain insights into the underlying patterns and trends present in the survey responses. By using descriptive statistics, analysts can effectively communicate the essential aspects of the data to stakeholders and make informed decisions based on a clear understanding of the survey results.
What is the difference between descriptive and inferential statistics in survey data analysis?
In the context of survey data analysis, understanding the distinction between descriptive and inferential statistics is crucial. Descriptive statistics focus on summarising and presenting the characteristics of the data collected through surveys, providing insights into central tendencies and variability within the sample. On the other hand, inferential statistics go beyond mere description by drawing conclusions and making predictions about the broader population based on the survey sample. Inferential statistics allow researchers to generalise findings, test hypotheses, and uncover relationships between variables, ultimately guiding decision-making processes with a deeper level of statistical insight.
How can visualisation techniques enhance the presentation of statistical findings from survey data?
Visualisation techniques play a crucial role in enhancing the presentation of statistical findings from survey data by transforming complex numbers and relationships into easily digestible visual representations. Charts, graphs, and infographics can effectively communicate key insights, trends, and patterns uncovered through statistical analysis, making the information more accessible and engaging for a wider audience. Visualisations not only aid in presenting data in a visually appealing manner but also help stakeholders quickly grasp the significance of the findings, facilitating better decision-making based on survey results. By utilising visualisation techniques, researchers can enhance the clarity and impact of their statistical findings, ensuring that the key messages are effectively conveyed and understood.