The Importance of Likert Scale in Statistical Analysis
When conducting research or surveys to gather data and insights, one common method used is the Likert scale. The Likert scale is a popular tool for measuring attitudes, opinions, perceptions, and preferences of respondents. It provides researchers with a structured way to collect and analyse data quantitatively.
The Likert scale typically consists of several statements or questions to which respondents indicate their level of agreement or disagreement. Responses are usually measured on a scale ranging from “strongly agree” to “strongly disagree,” allowing for a range of responses that can be quantified for statistical analysis.
One of the key benefits of using the Likert scale in statistical analysis is its ability to provide researchers with valuable insights into the attitudes and opinions of respondents. By assigning numerical values to responses, researchers can quantify and measure the data, making it easier to identify patterns, trends, and relationships within the dataset.
Statistical analysis of Likert scale data allows researchers to calculate descriptive statistics such as mean, median, mode, and standard deviation. These metrics help in summarising the data and understanding the central tendency and variability of responses. Additionally, inferential statistical techniques like t-tests, ANOVA (Analysis of Variance), and regression analysis can be applied to draw meaningful conclusions from the data.
Moreover, the Likert scale enables researchers to conduct comparative analyses between different groups or variables. By comparing responses across demographics, time periods, or experimental conditions, researchers can uncover valuable insights that inform decision-making processes.
In conclusion, the Likert scale plays a crucial role in statistical analysis by providing researchers with a structured method for collecting and quantifying data related to attitudes and opinions. Its versatility and applicability across various research domains make it an indispensable tool for gaining insights into human behaviour and preferences.
Essential FAQs on Statistical Analysis for Likert Scale Data
- What statistical analysis should I use for Likert scale data?
- How do you analyze a 5 point Likert scale?
- Can you use ANOVA for Likert scale?
- How do you Analyse Likert scale results?
- Which descriptive statistics to use for Likert scale?
- What statistical analysis is best for Likert scale?
- Can you use ANOVA for Likert scale data?
- How do you analyze the results of a Likert scale?
What statistical analysis should I use for Likert scale data?
When analysing Likert scale data, researchers often wonder about the most suitable statistical analysis to apply. The choice of statistical analysis for Likert scale data depends on the research objectives and the nature of the data. Commonly used statistical techniques for Likert scale data include descriptive statistics like mean, median, and mode to summarise responses. Additionally, inferential statistical tests such as t-tests, ANOVA (Analysis of Variance), chi-square tests, and regression analysis can be utilised to explore relationships, differences between groups, and predictive modelling based on Likert scale responses. Selecting the appropriate statistical analysis method is crucial in extracting meaningful insights from Likert scale data and drawing accurate conclusions in research studies.
How do you analyze a 5 point Likert scale?
When analysing a 5-point Likert scale, researchers typically assign numerical values to each response option, such as 1 for “strongly disagree” and 5 for “strongly agree.” This allows for quantitative analysis of the data collected. Common statistical methods used to analyse a 5-point Likert scale include calculating descriptive statistics like mean and standard deviation to summarise the responses. Researchers can also conduct inferential statistical tests, such as t-tests or ANOVA, to compare responses between groups or variables and draw meaningful conclusions from the data. By utilising these analytical techniques, researchers can gain valuable insights into attitudes, opinions, and preferences expressed through a 5-point Likert scale.
Can you use ANOVA for Likert scale?
When it comes to Likert scale data analysis, a common question that arises is whether ANOVA (Analysis of Variance) can be used. ANOVA is a statistical technique typically used to compare means between three or more groups. While some researchers argue that ANOVA may not be ideal for Likert scale data due to assumptions of normality and equal variances, others suggest that it can still be applied with caution, especially when sample sizes are large enough. It is important to consider the nature of the Likert scale data, the research question at hand, and the specific assumptions of ANOVA before deciding whether to use this method for analysis.
How do you Analyse Likert scale results?
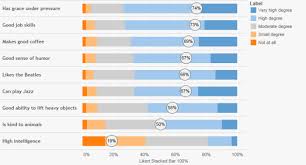
Analysing Likert scale results involves several steps to derive meaningful insights from the data collected. Firstly, the responses on the Likert scale need to be coded numerically, typically ranging from 1 to 5 or 1 to 7, representing varying degrees of agreement or disagreement. Once the data is coded, descriptive statistics such as mean, median, mode, and standard deviation can be calculated to summarise the central tendency and variability of responses. Researchers can also visualise the data using graphs like bar charts or histograms to identify patterns and trends. Furthermore, inferential statistical techniques such as t-tests, ANOVA, or regression analysis can be applied to determine relationships between variables and draw statistically significant conclusions. Overall, analysing Likert scale results requires a systematic approach that combines numerical calculations with statistical methods to interpret and understand the data effectively.
Which descriptive statistics to use for Likert scale?
When analysing Likert scale data, several descriptive statistics can be used to summarise and interpret the responses effectively. Commonly employed descriptive statistics for Likert scale data include measures of central tendency such as the mean, median, and mode. These statistics provide insights into the average or most typical response from respondents. Additionally, measures of dispersion like standard deviation and range help in understanding the variability or spread of responses around the central value. Utilising these descriptive statistics allows researchers to gain a comprehensive understanding of the distribution of responses on a Likert scale and identify patterns or trends within the dataset.
What statistical analysis is best for Likert scale?
When considering the most suitable statistical analysis for Likert scale data, researchers often rely on non-parametric tests due to the ordinal nature of Likert scale responses. Non-parametric tests such as the Mann-Whitney U test, Kruskal-Wallis test, and Spearman’s rank correlation are commonly used to analyse Likert scale data as they do not assume a normal distribution of data. These tests provide robust and reliable results when comparing groups or assessing relationships between variables based on Likert scale responses. By selecting appropriate non-parametric statistical analyses, researchers can effectively interpret and draw meaningful conclusions from Likert scale data in their research studies.
Can you use ANOVA for Likert scale data?
When considering the use of ANOVA for Likert scale data, it is important to understand that ANOVA is a statistical technique primarily designed for analysing continuous data with interval or ratio scales. While Likert scale data is ordinal in nature, which represents ordered categories without a true zero point, ANOVA may still be used under certain conditions. However, it is essential to acknowledge the potential limitations and assumptions that come with applying ANOVA to Likert scale data. Researchers often encounter challenges in meeting the assumptions of homogeneity of variances and normally distributed residuals when using ANOVA with Likert scale responses. Therefore, careful consideration and validation of these assumptions are necessary before deciding to apply ANOVA to Likert scale data to ensure the reliability and validity of the statistical analysis results.
How do you analyze the results of a Likert scale?
Analysing the results of a Likert scale involves several steps to derive meaningful insights from the collected data. Firstly, researchers calculate descriptive statistics such as mean, median, mode, and standard deviation to summarise the responses and understand the central tendency and variability within the dataset. Next, researchers may use inferential statistical techniques like t-tests, ANOVA (Analysis of Variance), or regression analysis to explore relationships between variables and draw comparisons across different groups or conditions. By applying these analytical methods, researchers can uncover patterns, trends, and correlations in the Likert scale data, ultimately leading to valuable conclusions and actionable insights for decision-making processes.


