The Power of R Data Analysis
Data analysis is a crucial aspect of decision-making in various fields, from business to scientific research. Among the plethora of tools available for data analysis, R stands out as a powerful and versatile programming language. With its rich ecosystem of packages and libraries, R offers unparalleled capabilities for exploring, visualising, and interpreting data.
Why Choose R for Data Analysis?
R is widely preferred by data analysts and statisticians for several reasons:
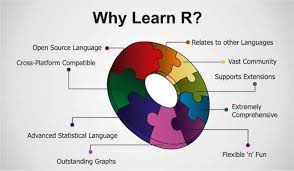
- Open-Source: R is an open-source language, making it accessible to all users without any licensing costs.
- Extensive Libraries: The Comprehensive R Archive Network (CRAN) provides a vast collection of packages for various statistical analyses and data visualisations.
- Statistical Capabilities: R offers advanced statistical functions that enable users to perform complex analyses with ease.
- Data Visualisation: With packages like ggplot2, R allows users to create stunning visualisations that aid in understanding the data better.
Applications of R Data Analysis
R data analysis finds applications in diverse fields, including:
- Business Analytics: Companies use R to analyse customer behaviour, forecast sales trends, and make informed business decisions.
- Bioinformatics: In the field of genetics and biology, R is used for analysing DNA sequences, gene expression data, and more.
- Social Sciences: Researchers leverage R for analysing survey data, conducting experiments, and drawing statistical inferences.
The Future of Data Analysis with R
As the volume and complexity of data continue to grow exponentially, the demand for robust data analysis tools like R will only increase. With its flexibility, scalability, and community support, R remains at the forefront of modern data analysis practices.
If you are looking to harness the power of data through insightful analysis and visualisation, consider incorporating R into your toolkit. Its versatility and capabilities make it a valuable asset for anyone working with data in today’s information-driven world.
Top 6 Advantages of Using R for Data Analysis: From Cost-Effectiveness to Advanced Visualisation
- Open-source nature of R makes it accessible to all users without licensing costs.
- Extensive collection of packages on CRAN provides a wide range of tools for statistical analysis and data visualisation.
- Advanced statistical functions in R enable users to perform complex analyses efficiently.
- R’s data visualisation capabilities, especially with ggplot2, allow for the creation of compelling and insightful visuals.
- Strong community support ensures that users have access to resources, tutorials, and assistance when using R for data analysis.
- R’s flexibility and scalability make it suitable for analysing diverse types of data across various industries.
Challenges in R Data Analysis: Navigating the Learning Curve, Performance Concerns, and GUI Limitations
Open-source nature of R makes it accessible to all users without licensing costs.
The open-source nature of R sets it apart as a highly accessible tool for data analysis, as it eliminates the barrier of licensing costs that can often restrict users from utilising powerful software. By being freely available to all, R democratises the field of data analysis, allowing individuals and organisations of all sizes to leverage its advanced statistical capabilities without financial constraints. This accessibility not only promotes inclusivity but also fosters a vibrant community of users who contribute to the continual growth and improvement of R as a versatile platform for data exploration and interpretation.
Extensive collection of packages on CRAN provides a wide range of tools for statistical analysis and data visualisation.
The extensive collection of packages available on the Comprehensive R Archive Network (CRAN) offers a diverse array of tools for statistical analysis and data visualisation. This wealth of resources empowers users to delve deep into their data, explore various analytical techniques, and create compelling visual representations. Whether it’s conducting complex statistical tests or crafting interactive graphs, the abundance of packages on CRAN ensures that users have access to a wide range of capabilities to enhance their data analysis projects with precision and creativity.
Advanced statistical functions in R enable users to perform complex analyses efficiently.
The advanced statistical functions available in R empower users to efficiently conduct intricate analyses with precision and speed. By leveraging these capabilities, data analysts and researchers can delve deep into complex datasets, extract meaningful insights, and make informed decisions based on robust statistical methodologies. R’s ability to handle sophisticated analyses seamlessly enhances the efficiency and accuracy of data interpretation, making it a valuable tool for tackling challenging analytical tasks in various domains.
R’s data visualisation capabilities, especially with ggplot2, allow for the creation of compelling and insightful visuals.
R’s data visualisation capabilities, particularly with the ggplot2 package, empower users to craft captivating and enlightening visuals that bring data to life. By utilising ggplot2’s extensive features and customisation options, analysts can create visually appealing graphs, charts, and plots that not only showcase the data effectively but also uncover hidden patterns and trends. This ability to generate compelling visuals enhances the storytelling aspect of data analysis, enabling stakeholders to gain deeper insights and make informed decisions based on a clear understanding of the data.
Strong community support ensures that users have access to resources, tutorials, and assistance when using R for data analysis.
The strong community support surrounding R data analysis ensures that users have a wealth of resources, tutorials, and assistance at their fingertips. Whether beginners seeking guidance or experienced users looking for advanced techniques, the active community provides a supportive environment for all levels of proficiency. This collaborative ecosystem not only fosters learning and skill development but also encourages knowledge sharing and problem-solving, making R a reliable choice for data analysts seeking continuous improvement and innovation in their analytical pursuits.
R’s flexibility and scalability make it suitable for analysing diverse types of data across various industries.
R’s flexibility and scalability make it a standout choice for data analysis across a wide range of industries. Whether it’s processing large datasets in finance, conducting intricate statistical analyses in healthcare, or visualising consumer trends in marketing, R’s adaptability allows it to handle diverse types of data with ease. Its ability to scale from small projects to enterprise-level applications makes it a versatile tool for professionals seeking robust data analysis solutions tailored to their specific industry needs.
Steep Learning Curve
Navigating the world of R data analysis can present a significant hurdle for beginners, primarily due to its steep learning curve. The language’s intricate syntax and wide array of functions can be overwhelming for those new to data analysis. Understanding how to effectively utilise R’s capabilities may require dedicated time and effort to grasp, making it a challenging initial step for aspiring data analysts.
Performance Issues
When it comes to handling extremely large datasets, one significant drawback of using R for data analysis is its performance issues. Due to its design and structure, R can be slower when processing massive amounts of data compared to languages like Python or SQL. This limitation can hinder the efficiency and speed of data analysis tasks, especially in scenarios where quick processing times are essential. In such cases, users may need to consider alternative tools that are better suited for handling large datasets to ensure optimal performance and productivity in their data analysis workflows.
Limited GUI Support
One notable drawback of R data analysis is its limited GUI support. Unlike some other data analysis tools that offer intuitive graphical user interfaces (GUIs), R predominantly relies on command-line interfaces. This can pose a challenge for users who are more accustomed to interacting with software through visual interfaces, potentially leading to a steeper learning curve and hindering the adoption of R by those seeking a more user-friendly experience.


