The Power of Data Analytics Dashboards in Driving Informed Decision-Making
In today’s data-driven world, businesses are constantly seeking ways to extract valuable insights from the vast amounts of data at their disposal. One powerful tool that has revolutionised the way organisations analyse and visualise data is the data analytics dashboard.
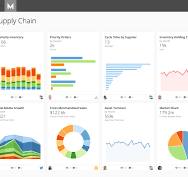
A data analytics dashboard is a user-friendly interface that displays key metrics, performance indicators, and other important data points in a visually appealing format. By consolidating and presenting complex data sets in an easy-to-understand manner, dashboards enable decision-makers to quickly grasp trends, identify patterns, and make informed decisions based on real-time information.
One of the primary benefits of using a data analytics dashboard is its ability to provide a comprehensive overview of an organisation’s performance across various departments and functions. With just a glance, managers can assess key metrics such as sales figures, customer satisfaction scores, and operational efficiency indicators, allowing them to pinpoint areas that require attention or improvement.
Furthermore, data analytics dashboards empower users to drill down into specific data points for more detailed analysis. By interacting with the dashboard interface, users can filter information based on different criteria, compare historical trends, and uncover hidden insights that may have otherwise gone unnoticed.
Another advantage of utilising data analytics dashboards is the ability to track progress towards predefined goals and objectives. By setting up visualisations that track key performance indicators against targets or benchmarks, organisations can monitor their performance in real-time and take corrective actions when necessary to stay on course.
Moreover, data analytics dashboards facilitate collaboration and communication within an organisation by providing a shared platform for stakeholders to access up-to-date information and collaborate on decision-making processes. Whether it’s during team meetings or strategic planning sessions, having a centralised source of truth ensures that everyone is working with the same accurate data.
In conclusion, data analytics dashboards play a crucial role in helping businesses harness the power of their data to drive informed decision-making. By providing intuitive visualisations, enabling detailed analysis, tracking progress towards goals, and fostering collaboration among stakeholders, dashboards empower organisations to stay agile in an increasingly competitive landscape.
Understanding Data Analytics Dashboards: Key Features, Benefits, and Security Considerations
- What is a data analytics dashboard?
- How does a data analytics dashboard help businesses?
- What are the key features of a data analytics dashboard?
- How can data analytics dashboards benefit decision-making processes?
- What types of data can be visualised on a data analytics dashboard?
- Are data analytics dashboards customizable to suit specific business needs?
- How user-friendly are data analytics dashboards for non-technical users?
- Can real-time data be displayed on a data analytics dashboard?
- What security measures are in place to protect sensitive information on a data analytics dashboard?
What is a data analytics dashboard?
A data analytics dashboard is a powerful tool that provides a user-friendly interface for displaying key metrics, performance indicators, and other important data points in a visually appealing format. Essentially, it serves as a centralised platform that consolidates complex data sets into easy-to-understand visualisations, enabling users to gain valuable insights and make informed decisions based on real-time information. By offering a comprehensive overview of an organisation’s performance across various departments and functions, data analytics dashboards play a crucial role in enhancing data-driven decision-making processes and driving business success.
How does a data analytics dashboard help businesses?
A data analytics dashboard helps businesses by providing a comprehensive and real-time visual representation of key metrics and performance indicators. By consolidating complex data sets into easy-to-understand charts, graphs, and tables, dashboards enable decision-makers to quickly identify trends, patterns, and outliers that impact the business. This allows organisations to make informed decisions promptly, optimise processes, track progress towards goals, and ultimately improve overall performance. Additionally, data analytics dashboards promote transparency and collaboration within the organisation by offering a centralised platform for stakeholders to access and interpret data, fostering data-driven decision-making across all levels of the business.
What are the key features of a data analytics dashboard?
When considering the key features of a data analytics dashboard, it is essential to highlight its ability to present data in a visually engaging and easily digestible format. An effective dashboard should offer customizable visualisations such as charts, graphs, and tables that allow users to quickly identify trends, patterns, and outliers within the data. Additionally, interactive capabilities like drill-down functionality and filtering options enable users to delve deeper into specific data points for more detailed analysis. Real-time data updates, integration with multiple data sources, and the ability to set performance benchmarks are also crucial features that ensure that the dashboard provides accurate and actionable insights for informed decision-making.
How can data analytics dashboards benefit decision-making processes?
Data analytics dashboards offer a multitude of benefits that significantly enhance decision-making processes within organisations. By providing a visual representation of key metrics and performance indicators in real-time, dashboards enable decision-makers to quickly identify trends, patterns, and anomalies within the data. This instant access to critical information empowers users to make informed decisions promptly, leading to more agile and effective responses to changing business conditions. Additionally, the ability to drill down into specific data points for deeper analysis allows decision-makers to gain valuable insights and understand the underlying factors driving business performance. Ultimately, data analytics dashboards streamline the decision-making process by consolidating complex data sets into easily digestible visualisations, facilitating quicker and more accurate strategic decisions.
What types of data can be visualised on a data analytics dashboard?
A data analytics dashboard can visualise a wide range of data types, including but not limited to key performance indicators (KPIs), financial metrics, sales figures, customer demographics, website traffic data, social media engagement metrics, and operational efficiency indicators. By leveraging various visualisation techniques such as charts, graphs, tables, and heatmaps, organisations can gain valuable insights into their business performance and make data-driven decisions based on real-time information. The flexibility of data analytics dashboards allows users to customise the visualisations according to their specific needs and preferences, enabling them to monitor trends, track progress towards goals, and identify opportunities for improvement across different aspects of their operations.
Are data analytics dashboards customizable to suit specific business needs?
Businesses often inquire about the customisability of data analytics dashboards to align with their specific needs. The answer is a resounding yes – data analytics dashboards are highly customisable to accommodate the unique requirements of each business. From selecting the key performance indicators (KPIs) to choosing the visualisation styles and layout, businesses have the flexibility to tailor their dashboards to capture precisely the insights that matter most to them. This adaptability ensures that businesses can focus on the metrics relevant to their operations, industry, and strategic objectives, ultimately enabling them to make better-informed decisions based on data that is meaningful and actionable.
How user-friendly are data analytics dashboards for non-technical users?
Data analytics dashboards are designed to be user-friendly for non-technical users, providing an intuitive interface that allows individuals without a technical background to easily navigate and interpret data. With visually appealing charts, graphs, and interactive elements, these dashboards present complex information in a digestible format, enabling non-technical users to gain valuable insights without the need for specialised training or expertise. Additionally, features such as drag-and-drop functionality, customisable widgets, and predefined templates further enhance the usability of data analytics dashboards for non-technical users, empowering them to explore data, uncover trends, and make informed decisions with confidence.
Can real-time data be displayed on a data analytics dashboard?
Real-time data can indeed be displayed on a data analytics dashboard, providing users with up-to-the-minute insights into key metrics and performance indicators. By integrating real-time data sources and leveraging advanced data visualisation techniques, organisations can monitor changes as they happen, enabling swift decision-making and proactive responses to emerging trends. The ability to display real-time data on a dashboard enhances the agility and responsiveness of businesses, allowing them to stay ahead of the curve in today’s fast-paced and dynamic business environment.
What security measures are in place to protect sensitive information on a data analytics dashboard?
Ensuring the security of sensitive information on a data analytics dashboard is paramount in today’s digital landscape. To safeguard confidential data, robust security measures are implemented, including encryption protocols to protect data both in transit and at rest. Access controls are also enforced to restrict data access to authorised personnel only, with role-based permissions and authentication mechanisms in place. Regular security audits and monitoring help detect and prevent any potential breaches, while compliance with industry standards such as GDPR and ISO certifications ensures that data privacy regulations are met. By implementing these stringent security measures, organisations can confidently utilise data analytics dashboards while maintaining the integrity and confidentiality of their sensitive information.