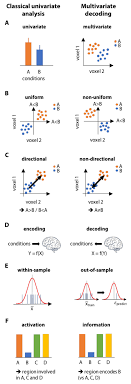
The Importance of Univariate Statistics in Data Analysis
Univariate statistics is a fundamental concept in data analysis that focuses on examining and summarising the characteristics of a single variable. By exploring the distribution, central tendency, and variability of individual data points, univariate statistics provides valuable insights into the nature of the data set.
Understanding Data Distribution
One key aspect of univariate statistics is analysing the distribution of data. This involves exploring how data points are spread out across different values and identifying any patterns or anomalies present. Common measures used in this analysis include frequency distributions, histograms, and box plots, which help visualise the shape and spread of the data.
Exploring Central Tendency
Central tendency is another crucial component of univariate statistics. It refers to the typical or central value around which data points tend to cluster. Measures such as mean, median, and mode are used to represent central tendency and provide a sense of the average value within the data set. Understanding central tendency helps in interpreting the overall trend or behaviour of the variable being analysed.
Assessing Variability
Variability is an essential consideration in univariate statistics as it indicates how much individual data points deviate from the central value. Measures like range, variance, and standard deviation are commonly used to quantify variability and provide insights into the spread or dispersion of data points. Assessing variability helps in understanding the level of consistency or variation within the dataset.
Applications in Data Analysis
Univariate statistics play a crucial role in various fields such as economics, psychology, biology, and more. By examining individual variables independently, researchers can uncover trends, patterns, and relationships that may not be apparent when considering multiple variables simultaneously. Univariate analysis serves as a foundation for more advanced statistical techniques and hypothesis testing.
Conclusion
In conclusion, univariate statistics form an essential part of data analysis by providing valuable insights into individual variables’ characteristics. By exploring data distribution, central tendency, and variability through univariate analysis, researchers can gain a deeper understanding of their datasets’ properties and make informed decisions based on statistical evidence.
Mastering Univariate Statistics: 7 Essential Tips for Effective Single-Variable Analysis
- Understand the purpose of univariate statistics in analysing single variables.
- Choose the appropriate univariate statistical measure based on the type of data (e.g. mean, median, mode).
- Ensure your data is clean and free from outliers before conducting univariate analysis.
- Interpret the results of univariate statistics in the context of your research question or hypothesis.
- Visualise univariate data using histograms, box plots, or bar charts to gain insights.
- Consider measures of variability such as range, variance, and standard deviation for a comprehensive analysis.
- Be cautious with generalisations when interpreting univariate statistics without considering other variables.
Understand the purpose of univariate statistics in analysing single variables.
Understanding the purpose of univariate statistics is essential when analysing single variables. By focusing on individual variables independently, univariate statistics provide valuable insights into the distribution, central tendency, and variability of data points. This approach allows researchers to uncover patterns, trends, and anomalies within a dataset that may not be apparent when considering multiple variables simultaneously. By grasping the significance of univariate statistics in analysing single variables, researchers can make informed decisions based on a comprehensive understanding of each variable’s characteristics.
Choose the appropriate univariate statistical measure based on the type of data (e.g. mean, median, mode).
When conducting univariate statistical analysis, it is essential to select the appropriate measure based on the type of data being analysed. For numerical data sets, measures such as mean, median, and mode are commonly used to represent central tendency. The mean is suitable for data that follows a normal distribution, while the median is more robust to outliers and skewed data. On the other hand, the mode is ideal for categorical or nominal data where identifying the most frequently occurring value is crucial. By choosing the right univariate statistical measure according to the data’s characteristics, researchers can accurately summarise and interpret the variable under study.
Ensure your data is clean and free from outliers before conducting univariate analysis.
Before embarking on univariate analysis, it is crucial to ensure that your data is clean and free from outliers. Outliers can significantly skew the results of univariate statistics, leading to inaccurate interpretations and conclusions. By thoroughly cleaning the data and identifying any outliers, researchers can ensure the reliability and validity of their analysis. Removing outliers or addressing them appropriately allows for a more accurate representation of the variable under study, enhancing the quality of the univariate analysis results.
Interpret the results of univariate statistics in the context of your research question or hypothesis.
Interpreting the results of univariate statistics in the context of your research question or hypothesis is crucial for deriving meaningful insights from your data analysis. By aligning the findings of univariate analysis with the specific research question or hypothesis you are investigating, you can determine whether the observed patterns, trends, or relationships are relevant and significant in addressing your research objectives. This approach allows you to draw valid conclusions and make informed decisions based on how individual variables behave within the context of your study, enhancing the overall validity and applicability of your research findings.
Visualise univariate data using histograms, box plots, or bar charts to gain insights.
Visualising univariate data using histograms, box plots, or bar charts is a valuable tip in statistical analysis. These visualisation techniques offer a clear and intuitive way to explore the distribution, central tendency, and variability of a single variable. Histograms provide a visual representation of the frequency distribution of data points, while box plots offer insights into the spread and outliers within the dataset. Bar charts are effective in comparing different categories or values within the variable. By utilising these visual tools, analysts can quickly identify patterns, trends, and anomalies in the data, facilitating a deeper understanding and interpretation of univariate statistics.
Consider measures of variability such as range, variance, and standard deviation for a comprehensive analysis.
When conducting an analysis using univariate statistics, it is crucial to consider measures of variability such as range, variance, and standard deviation. These metrics provide valuable information about how data points are dispersed around the central tendency, offering insights into the spread and consistency of the dataset. By incorporating measures of variability in the analysis, researchers can obtain a more comprehensive understanding of the distribution and characteristics of the variable under study, enabling them to make more informed interpretations and decisions based on the data’s variability.
Be cautious with generalisations when interpreting univariate statistics without considering other variables.
When interpreting univariate statistics, it is crucial to exercise caution with generalisations and conclusions drawn solely from the analysis of a single variable. Without considering other relevant variables or factors that may influence the relationship, there is a risk of making inaccurate or misleading assumptions. It is important to remember that univariate statistics provide insights into individual variables but may not capture the full complexity of real-world scenarios. Therefore, a comprehensive analysis that takes into account multiple variables and their interactions is essential for making informed decisions and drawing reliable conclusions in data interpretation.


