The Power of Correlation Data Analysis
Correlation data analysis is a vital tool in the field of statistics and data science that helps us understand the relationship between two or more variables. By examining how changes in one variable are associated with changes in another, we can uncover valuable insights and make informed decisions.
Understanding Correlation
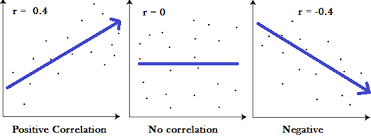
Correlation measures the strength and direction of a linear relationship between two variables. It is represented by a correlation coefficient, which ranges from -1 to 1. A coefficient close to 1 indicates a strong positive correlation, meaning that as one variable increases, the other also tends to increase. On the other hand, a coefficient close to -1 signifies a strong negative correlation, where one variable increases as the other decreases.
Applications of Correlation Data Analysis
Correlation analysis is widely used across various industries and disciplines. In finance, it helps investors understand how different assets move in relation to each other, aiding in portfolio diversification. In healthcare, correlation analysis can reveal relationships between lifestyle factors and health outcomes. Marketing professionals utilise correlation data analysis to identify patterns in consumer behaviour and improve targeted advertising strategies.
Challenges and Considerations
While correlation analysis provides valuable insights, it is essential to remember that correlation does not imply causation. Just because two variables are correlated does not mean that changes in one variable cause changes in the other. Additionally, outliers and confounding variables can distort correlation results, emphasising the importance of thorough data cleaning and interpretation.
Conclusion
Correlation data analysis is a powerful tool that allows us to uncover relationships within datasets and gain deeper insights into complex systems. By understanding how variables interact with each other, we can make more informed decisions and drive meaningful outcomes across various fields.
Understanding Correlation Data Analysis: Key Concepts, Measurement, Types, Limitations, and Industry Applications
- What is correlation data analysis?
- How is correlation measured in data analysis?
- What are the types of correlations used in data analysis?
- What are the limitations of correlation analysis?
- How is correlation data analysis applied in different industries?
What is correlation data analysis?
Correlation data analysis is a statistical technique used to examine the relationship between two or more variables. It helps us understand how changes in one variable are associated with changes in another, providing insights into the patterns and trends within a dataset. By calculating a correlation coefficient, which ranges from -1 to 1, we can determine the strength and direction of the relationship between variables. Correlation data analysis is a valuable tool in various fields, allowing researchers and analysts to identify connections, make predictions, and inform decision-making processes based on empirical evidence.
How is correlation measured in data analysis?
In data analysis, correlation is measured using a correlation coefficient, typically denoted as “r.” The correlation coefficient quantifies the strength and direction of the relationship between two variables. It ranges from -1 to 1, where a value close to 1 indicates a strong positive correlation, meaning that as one variable increases, the other tends to increase as well. Conversely, a value close to -1 signifies a strong negative correlation, indicating that as one variable increases, the other decreases. A correlation coefficient of 0 suggests no linear relationship between the variables. By calculating this numerical measure, data analysts can assess the degree of association between variables and gain valuable insights into their interdependencies.
What are the types of correlations used in data analysis?
In data analysis, various types of correlations are commonly used to measure the relationship between variables. The most common types of correlations include Pearson correlation, which assesses the linear relationship between two continuous variables; Spearman correlation, which evaluates the monotonic relationship between variables and is suitable for ordinal data; and Kendall correlation, which measures the strength of association between variables when dealing with ranked data. Each type of correlation has its strengths and limitations, allowing analysts to choose the most appropriate method based on the nature of their data and research objectives.
What are the limitations of correlation analysis?
Correlation analysis, while a valuable tool for understanding relationships between variables, has certain limitations that must be considered. One key limitation is that correlation does not imply causation; just because two variables are correlated does not mean that changes in one variable directly cause changes in the other. Additionally, correlation analysis may overlook non-linear relationships between variables, leading to potentially misleading interpretations. Outliers and the presence of confounding variables can also impact correlation results, highlighting the importance of careful data interpretation and consideration of external factors. Understanding these limitations is crucial for conducting accurate and meaningful correlation analysis in various fields.
How is correlation data analysis applied in different industries?
Correlation data analysis plays a crucial role in various industries by uncovering valuable insights and relationships between variables. In finance, correlation analysis is applied to understand how different assets move in relation to each other, aiding investors in portfolio diversification and risk management strategies. In healthcare, correlation data analysis helps identify connections between lifestyle factors and health outcomes, enabling healthcare professionals to develop targeted interventions and improve patient care. Marketing professionals utilise correlation analysis to identify patterns in consumer behaviour and enhance targeted advertising strategies for better engagement and conversion rates. Across industries, the application of correlation data analysis provides a foundation for informed decision-making and strategic planning based on data-driven insights.